 |
Last Update:
Thursday November 22, 2018
|
| [Home] |
|
Volume 16 Issue 2 Pages 58 - 110 (October 1999) Citation: Jameson, Rl.J. & Jeffries, S. (1999) Results of the 1999 Survey of the Reintroduced Sea Otter Population in Washington State IUCN Otter Spec. Group Bull. 16(2): 79 - 85 Results of the 1999 Survey of the Reintroduced Sea Otter Population in Washington State Ronald J. Jameson1 and Steven Jeffries2 1
United States Geological Survey, Biological Resources Division, Western
Ecological Research Center
Fifty-nine sea otters (Enhydra lutris kenyoni, WILSON
et al., 1991) were released off the west coast of the Olympic
Peninsula of Washington State during the summers of 1969 and 1970 (JAMESON
et al., 1982); all had been translocated from Amchitka Island,
Alaska. In 1969 the otters were released, with no time to acclimate or
recondition their fur, directly to the open ocean. Sixteen of the 29 sea
otters translocated in 1969 were found dead within 2 weeks on beaches
near the release site. No doubt some carcasses went undiscovered. In
1970 release procedures were changed, and the 30 otters were allowed to
acclimate for several days in floating pens prior to release. All were
liberated in excellent condition. Thus, the initial nuclear population
in Washington could never have been larger than 43 otters and may have
dropped to less than 10 individuals by the early 1970's. METHOD The survey was conducted from 6-9 July, 1999. The entire inshore area from Pt. Grenville (including Destruction Island) to the Sekiu River was surveyed, and counting conditions ranged from fair to excellent. The survey was conducted cooperatively by biologists of the Biological Resources Division of the United States Geological Survey, and the Washington Department of Fish and Wildlife. We wish to thank the U. S. Fish and Wildlife Service and the Washington Department of Fish and Wildlife whose funding support made this year's survey possible. Most of the range was surveyed from a fixed-winged aircraft, but several ground stations were occupied (Sand Pt., Cape Alava, and Norwegian Memorial). Protocol calls for two surveys per day over a period of three days. Thus, when conditions are favorable, six surveys of the entire range are completed. Inclement weather on 7 July precluded aerial surveys. Only one survey of the entire range was completed on 6 July, and two each were completed on 8 and 9 July. Because of the lower than expected count in 1998 and observations made by BRD researchers indicating some large groups of sea otters were resting offshore 1-2 kilometers, we decided to modify the survey technique this year to include an offshore transect. The survey total is calculated by summing the highest daily total for the south (Destruction Island to La Push) and north (La Push to Sekiu River) segments of the sea otter range. This assumes that there is little or no movement between the two segments during the survey period. Examination of survey data from years past and this year and documented movements of instrumented sea otters by USGS researchers in Washington support this assumption. Large groups (>20) observed from the air were counted and photographed and recounted from the developed photographs. Counts from photographs were used when image quality was good. RESULTS The highest count for the survey was 605 sea otters observed on 9 July under excellent conditions, an increase of nearly 40% from 1998 (Table 1). Since an increase of 40% is twice the maximum level of productivity for the species (KENYON, 1969; RIEDMAN and ESTES, 1990), and nearly 4 times the rate of increase for this population for the last decade (JAMESON and JEFFRIES, 1998), it seems reasonable to assume the 1998 count of 433 was inaccurate.
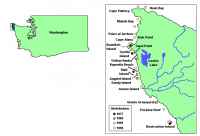
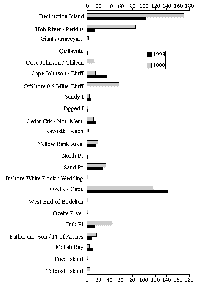
Most of the increase was noted South of La Push where record numbers were observed at Destruction Island and Perkins Reef, up 66% and 554% respectively. Particularly noteworthy was the increase of more than 5 fold at Perkins Reef (Table 1, Figure 1).
In 1998, 13 sea otters were counted at Perkins Reef, and this year 85 were tallied including 12 pups. This area is now second only to Cape Alava in having the largest concentration of reproducing females in the population, an important change in population distribution. Also of interest was the finding of a large group of animals offshore from Cape Johnson; and, based on this survey and observations by BRD biologists this past summer, an apparent increase in use of the area south of the Chilean Memorial by adult females. Few sea otters have been observed between Cape Johnson and La Push in past surveys. Pups are difficult to see from aircraft; therefore, the only accurate pup counts are those obtained at ground stations. Consequently, the total pup count presented in the table is undoubtedly low. Pup: independent ratios at ground count stations, however, continue to indicate pup production is good in Washington (17:100). During the summer months, the vast majority of sea otters in Washington occur between Makah Bay and Destruction Island. Last year nine sea otters were observed in the area from Tatoosh Island to Bullman Creek; this year, however, none were noted. Counts made during the winter months by BRD biologists show that 100(±) sea otters have occupied the area east of Cape Flattery each winter since 1995. The easternmost winter concentration in 1999 was located near Shipwreck Point about 15 kilometers east of Neah Bay. DISCUSSION Survey results this year support the hypothesis we proposed last year suggesting that survey conditions combined with a shift in distribution may have resulted in the low number observed in 1998 (JAMESON and JEFFRIES, 1998). The count expected for this year, based on the mean growth rate from 1989 through 1997, was 640. The actual observed number (605) is well within the range of expectations and suggests the 1998 count was truly anomalous. The results also exemplify the need to be flexible with survey protocols, while maintaining comparability, and the importance of making adjustments when field observations suggest there are changes in the distribution of the population that may affect survey results. Three major changes in distribution were noted this year. First, the number at Destruction Island increased by 66%, and the relatively low number of pups observed there suggests a large group of males or non-reproductive animals were using the island this July. Second, the Perkins reef count increased 5 fold since 1998 and was nearly 3 times that obtained in 1997. This is an important shift in distribution. Interestingly, the number of sea otters between Perkins Reef and La Push has changed very little in recent years with very few animals found throughout the area from Perkins Reef to just south of Cape Johnson. The most notable change to the north was the large group found offshore from Cape Johnson. A similar, but smaller, group was found offshore of Yellow Banks in 1998. Densities of sea otters between the north and south segments have changed as well (Table 2). Prior to this year the density and relative distribution of sea otter in Washington had changed little. Most otters were located north of La Push In 1997 and 1998, but this year the distribution has changed. This is particularly true for the area from Cape Alava to La Push and from La Push to the Hoh River. In 1997and 1998 the percentage of the total count in the northern area was 64-65%, and the southern area was occupied by about 24% of the population. This year the values have nearly equalized between the Cape Alava-La Push area and the La Push-Hoh River segment with 46% and 43%, respectively. This is a major shift in distribution from years past and only future surveys will determine if the changes are permanent. Although the proportions of the population in each segment have changed the actual dispersion patterns have not. In the northern half, sea otters are found throughout the area with the largest concentrations near Cape Alava; in the south, the vast majority of animals are found near the south end near Perkins Reef and Destruction Island (Table 1, Figure 2). However, the number of individuals between these locations and La Push are minimal even though habitat in the area appears to be good.
The results of the survey this year are encouraging and indicate the population has been growing at a finite rate of about 11% since 1989. Based on the recent shift of such a large number of sea otters to the southern end of the range it's tempting to speculate about expansion to the south. Although sea otters occurred near Pt. Grenville (SCAMMON, 1874) the historical record suggests there were few sea otters between there and Destruction Island. There is little quality habitat between Destruction Island and Pt. Grenville. This is particularly true for females with small pups. This important segment of the population seems to require refugia from winter storms in the form of protective reefs, kelp beds, or good haul out sites. Little such habitat exists south of Destruction Island before reaching the Pt. Grenville/Grays Harbor area. REFERENCES Jameson, R.J., Kenyon, K.W., Johnson, A.M.
& Wight, H.M. (1982). History and status of translocated sea
otter populations in North America. Wildlife Society Bulletin 10,
100-107. |
|||||||||||||||||||||||||||||||||||||||||||||||||||||||||||||||||||||||||||||||||||||||||||||||||||||||||||||||||||||||||||||||||||||||||||||||||||||||||||||||||||||||||||||||||||||||||||||||||||||||||||||||||||||||||||||||||||||||||||||||||||||||||||||||||||||||||||||||||||||||||||||||||||||||||||||||||||||||
| [Copyright © 2006 - 2050 IUCN/SSC OSG] | [Home] | [Contact Us] |

