 |
Last Update:
Friday November 23, 2018
|
| [Home] |
|
Volume 3 Pages 1 - 51 (March 1988) Citation: Green, R. and Green, J. (1988) The Second Scottish Otter Survey. IUCN Otter Spec. Group Bull. 3: 34 - 38 The Second Scottish Otter Survey R. and J. Green Barjarg, Barhill, Girvan, Ayrshire, KA26 0RB, Scotland In common with the other British national surveys of 1977-81 , the second Scottish otter survey occurred seven years after the first, in 1984-85. Effort was limited to 2650 of the original 4636 sites, excluding those administrative regions (Highland plus all the main island groups) which had produced greater than 90% positive results in the first national survey. Independent evidence from these areas suggested that they continued to form the stronghold of otters in Scotland and, hence in Britain as a whole. About two-thirds of mainland Scotland was resurveyed in 1984-65, covering most habitat types but concentrating on those areas where there was some previous evidence of a decline in distribution.
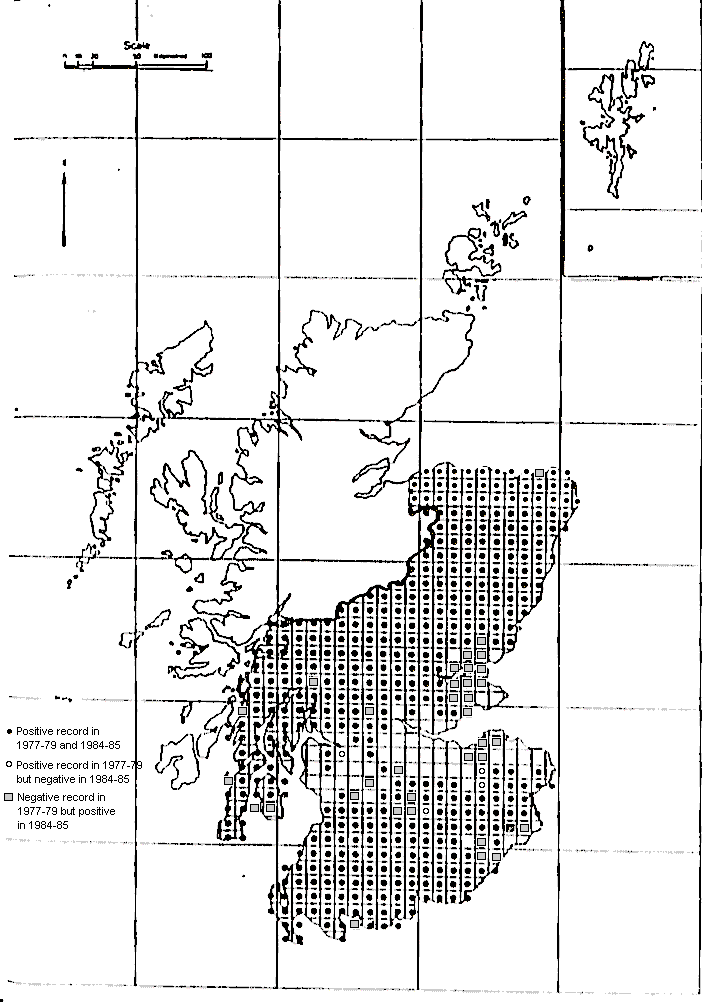
In all of the eight administrative regions which were investigated there was an increase in the number of sites at which otters were present (Table 1). The increase was statistically significant in five of these regions. Whereas, in the first survey, 16% of the ten-kilometre squares surveyed on both occasions produced no evidence of otters, in the second the figure was 10%. Twenty-one of the 33 newly positive squares were located in eastern Scotland from Tayside south, through Fife and Lothian to Borders region (Map) . This is an area with a relatively dense human population coupled with intensive agriculture, which had produced rather poor results in 1977-79. For Fife the improvement in survey results was independently substantiated by the occurrence of the first recorded otter road mortalities since 1969, plus a marked increase in otter sightings.
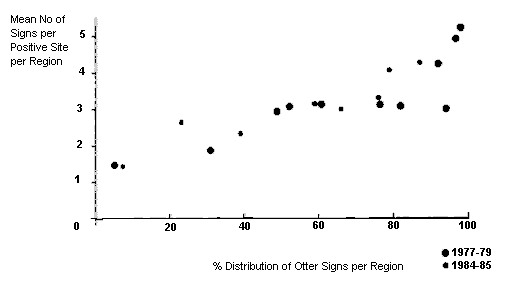
The number of sites which were positive in the first survey but negative in the second was small, at less than 3. 5% of the overall total. This equates with the perceptible margin of error in the survey technique identified after the first survey. Most of the new negatives were randomly distributed unlike the new positives, which tended to occur in clusters. The only possible indication of a decline in distribution was recorded in a small area of south-west Scotland where increasing acidity has damaged fish stocks. This apart, the south-west has a healthy otter population whose future prospects are linked with those of lowland Scotland generally and with adjacent regions in England. Despite unavoidable environmental variations, the two Scottish surveys produced a broadly similar pattern of results in terms of the percentage distribution of successful sites per unit area. This was also true for geographical variations in otter spraint density. The relationship between spraint numbers and percentage distribution of otter signs was analysed regionally, using Spearman's Rank Correlation Test. For both surveys, a close and similar correlation was established between the mean number of spraints found per successful site, per region, compared with the associated percentage of positive results (Figure 1). For 1977-79 the results were rs = 0.80; 9df:p < 0.01 : for 1984-85, rs = 0.95; 6df;p < 0.01.
The results of the second Scottish otter survey are modestly encouraging and parallel indications of a similar, modest improvement in status in Wales and parts of England. However, in all the areas of apparent improvement the otter probably remains a rather scarce animal whilst environmental change continues to affect otter habitat in an unplanned and sometimes explosive fashion. Of particular concern in Scotland at present is the extension of blanket forestry into wetland habitats in the north and the rapid development of a marine fish farm industry amongst the finest otter habitat in Britain. Further details of the survey are to be found in:- Green, J. & Green, R. (1987). Otter survey of Scotland, 1984-85. Vincent
Wildlife Trust, London. |
||||||||||||||||||||||||||||||||||||||||||||||||||||||||||||||||||||||||||||||||||||||||||||||||||||||||||||||||||||||||||||
| [Copyright © 2006 - 2050 IUCN/SSC OSG] | [Home] | [Contact Us] |

