IUCN/SSC Otter Specialist Group Bulletin

©IUCN/SCC Otter Specialist Group Volume 28A Proceedings Xth International Otter Colloquium, Hwacheon, South Korea Citation: Muanis, M.C. and Oliveira, L.F.B. (2011) Habitat Use and Food Niche Overlap by Neotropical Otter, Lontra longicaudis, and Giant Otter, Pteronura brasiliensis, in the Pantanal Wetland, Brazil . Proceedings of Xth International Otter Colloquium, IUCN Otter Spec. Group Bull. 28A: 76 - 85 Habitat Use and Food Niche Overlap by Neotropical Otter, Lontra longicaudis, and Giant Otter, Pteronura brasiliensis, in the Pantanal Wetland, Brazil Manoel C. Muanis1,2 and Luiz Flamarion B. Oliveira1 1Museu Nacional, Departamento de Vertebrados, Museu Nacional, UFRJ, Quinta da Boa Vista s/n. Rio de Janeiro, RJ, Brasil – CEP: 20940-040 Email:manoel.muanis@gmail.com |
 |
| (received 23rd March 2011, accepted 13th August 2011) |
Abstract: Environmental variables that can influence the presence of giant otter (Pteronura brasiliensis) and Neotropical otter (Lontra longicaudis) otters were studied in Correntoso River, Pantanal, Brazil. In this study site both species are diurnal and primarily piscivorous. Descriptive variables of habitats were selected based on literature related to other otter species around the world, and based on the judgment of the authors, using the concept of niche gestalt and the field experience with the species. Statistical analyses included Non-metric multidimensional scaling (NMS) using the Euclidean Distances matrix and the Principal Component Analysis (PCA). NMS was used to graphically summarize and analyse the multidimensional space components of the niche of both species. The results showed that giant otter has a smaller ecological space, enclosed by the Neotropical otter space. The ecological interpretation is that the Neotropical otter tends to be more generalist regarding the structure of habitat used. PCA was used to analyse differences between the species in subsets of variables. The variables were grouped in two subsets: one with variables about the structure of banks and the other about characteristics of water bodies. The main differences between the two species of otters are expressed through the axes related to water body’s features; the condition of banks appears to have less relevance. |
| Keywords: Pteronura brasiliensis, Lontra longicaudis, Pantanal, Habitat. |
| Française | Español |
INTRODUCTION
The Neotropical otter Lontra longicaudis (Olfers, 1818) presents the largest distribution of all South American species of the genus Lontra, occurring from northwest of Mexico to southern Uruguay, north of Paraguay and north of Province of Buenos in Argentina (Chehébar 1990, Redford and Eisenberg 1992). This is one of the largest north-south distributions amongst the species of the order Carnivora. The Neotropical otter is poorly known when compared to the other otters in the world. The species is classified as Data Deficient by IUCN (2007) regarding its conservation status.
This versatile otter is found in a very wide variety of environments: permanent, seasonal and intermittent rivers, streams and creeks, freshwater lakes, marshes and pools, saline, brackish or alkaline lakes, marshes and pools, shrub-dominated wetlands, geothermal wetlands, permanent inland deltas, shallow bays, rocky shores, estuaries, intertidal marshes, coastal freshwater, brackish and saline lagoons, reservoirs, ponds, fish farms, excavations, wastewater treatment areas, seasonally flooded and irrigated agricultural land, canals, drainage ditches (such as among rice and sugar cane plantations in Guyana), bogs, fens, swamps and wetlands. The species can live in evergreen and deciduous forests, in warm and cool climates, by the sea or in the rainforest. L. longicaudis has been seen in swampy areas of cushion plants and sedges surrounding glacial lakes in the high Andes of Ecuador at an altitude of 3885m (Waldemarin, 2004).
The giant otter Pteronura brasiliensis (Gmelin, 1788) occurs in the main river basins of South America, with exception of Chile (Groenendijk, 1998). Originally the species is widely distributed in lowlands east of the Andes, occurring in Colombia, Venezuela, Suriname, Guyana, French Guyana, Brazil, Ecuador, Peru, Bolivia, Paraguay and also mid latitude of Uruguay and possibly in the Parana Delta in Argentina (Foster-Turley et al., 1990; Parera, 1996; Groenendijk, 1998). Nowadays the species is classified as vulnerable (IUCN 2007) with a distribution intensely reduced and very fragmented. The specie is rare in large part of Bolivia, Ecuador and some areas of Colombia and Venezuela and southern Brazil, (Foster-Turley et al., 1990; Carter and Rosas, 1997), where it almost disappeared in the Pantanal in the 1970’s and 1980’s (Schweizer 1995). The species frequents rivers, streams, lakes, and swamps of tropical lowland rainforests, and is particularly vulnerable to human disturbance. Giant Otters live in slow-moving freshwater rivers, lakes and streams with gently sloping banks and overhanging vegetation (Duplaix, 1980).
The Pantanal is the biggest wetland of the world with more than 140 million hectares and has an enormous variety of habitats and species (Lourival et al., 2000). The study area of the present work is located in the Fazenda Santa Emília(19°30’18’’ S – 55°36’44’’W), which has a 2.700 ha surface and is located in the Pantanal of the Rio Negro, Mato Grosso do Sul, Western Brazil. This region of Pantanal is well preserved by reasons related to access, including at the wet season (Adámoli, 1982). The main river of the study region is Correntoso River, with meandering channel and black and fast moving water. The margins are composed by patches of riparian forest, and by open patches of grassy swamps. The headwaters and the delta present more homogeneous habitats dominated by swamps.
In the study area Neotropical and giant otters are completely diurnal and highly sympatric. They feed mainly on Carachiformes, Siluriformes and Perciformes fish families. The size of the fish seems to be a factor of differentiation on the diet of both species. The giant otter due have bigger body and hunts in groups, tends to consume bigger fish, with more than 20 centimeter whereas the neotropical otter prefers smaller benthic species, up to 15 centimeter (Muanis, 2004). The high diversity of fish occurrence in Pantanal, with more than 263 species (Britski et al., 1999) associate to the high abundance of them, makes the food supply for fish-eating species be high. And therefore the food axis is not the most important in the differentiation of ecological niches in the study area.
The present work intended to investigate the features of habitat used by these two syntopic otters. The central question of this work was how the Neotropical otter and Giant otter can coexist in the study area, considering the habitat structural features along the space used, under the perspective of the habitat structural niche components. This will allow inferences about resources partition - habitats, in this case - and structural features evaluation involved in space partition. Additionally, in few areas of the world it is possible to investigate two species of otters occurring in the same geographic area. For the two species that occur in Brazil, that ecological condition is now only observed in the Amazon and in the Pantanal.
MATERIAL AND METHODS
Multivariate analyses of environmental variables, which are components of the ecological niche of species, were used to describe the observed patterns in the collected sample (Hutchinson 1981). Variables were selected through previous experience with otters in the field. Some variables were already been used in similar work with Lutra lutra (Kruuk et al., 1989; Prenda and Granado-Lorencio, 1996), Lutra perspicillata (Anoop and Hussain, 2004) and Lontra longicaudis (Carrillo-Rubio and Lafón, 2004). Other variables used to describe characteristic of a habitat were widely discussed by Morrison et al. (1992, 1995).
Plots with 10m length (parallel to the river) and 2,5m width (perpendicular to the river) were set on each point of occurrence of the species - or close the margin, when the record was in the river - to sampling the environmental variables. Surveys were conducted daily between June and August 2007. Sights and tracks (footprints, dens, spraints, scratches in river banks, following Groenendijk et al. (2005), were considered evidence of occurrence. Twenty environmental variables were measured in each plot: (I) river width, (II) river depth, (III) slope of banks, (IV) number of fallen trunks, (V) average off all circumferences of the fallen trunks, (VI) number of creeks next to the point (VII) width of creek, (VIII) depth of creek, (IX) number of oxbow lakes near the point, (X) number of trees with more than 10cm of circumference, (XI) shrub density, (XII) degree of visual blockage on ground, (XIII) degree of visual blockage at 25 cm, (XIV) degree of cover - visual estimation - at 50cm height, (XV) average circumference of trees at breast high, (XVI) percentage of canopy cover, (XVII) number of beaches next to the point, (XVIII) number of Bromelia (Bromeliaceae; gravatá), (XIX) presence of palms (Bactris; tucum), (XX) quantity of available roots (potential hiding places). See Table 1 on the method of measurement of each variable.
The habitat structural similarities of each sample were evaluated through dendrograms using UPGMA (average linkage clustering) as agglomerative clustering method. Non-metric Multidimensional Scaling (NMS) using Euclidean distances matrix and Principal Component Analysis (PCA) were used to delimit the multidimensional space used by both species, as a form to identify factors related to the use of habitats. For NMS the original variables were transformed into z scores (the media was subtracted from each sample value and the result divided by the standard deviation) to adjust the data to normal distribution (mean 0, variance 1). This was important to reduce the effect of the dimensions of each variable and the effect of different scales used. The NMS scores were plotted and the position of the species was identified by ellipses representing the 95% confidence interval of the distribution of the values.
For the Principal Component analysis the variable sets were subdivided in two subsets. One composed by variables representing the water bodies’ features. The other composed by variables representing adjacent conditions of the riverbank. From the correlation matrix was extracted the eigenvalues and their percentage of variance. The three main axes were plotted in three possible combinations, with the 95% confidence interval of scores delimited. The dendrograms were calculated through Statistica 6.1 software. NMS and PCA were obtained through PAST 7.1 software.
The diet overlap was measured using the Pianka Index (Pianka, 2000) through Ecosim 7 software. This index measures the relative amount of habitat overlap between each pair of species and ranges from a minimum of 0.0 (no shared habitats) to a maximum of 1.0 (identical habitat use).
The differences between the items consumed by species were calculated for both wet and dry season. We not included data related to the availability of prey (fish) in the evaluated areas.
RESULTS AND DISCUSSION
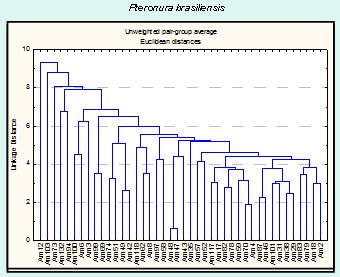
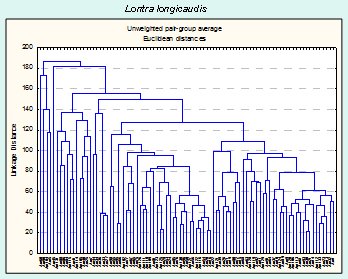
The field work results in 134 samples points of occurrence for Neotropical and giant otter. The Neotropical otter and the giant otter present different patterns of habitat use, when compared through habitat features (Fig. 1,2). Both figures express the wide distribution and variability of sites used by the Neotropical otter, considering the habitat structural features. The Neotropical otter appears to use a variety of habitats and microhabitats characterized by different structural features. The pattern suggests that the species use a more varied mosaic than that of the giant otter and is able to use portions with different structure and composition.
Under a multidimensional perspective (Fig. 3), the ecological space used by the giant otter is smaller and included in the space of the Neotropical otter. The distribution of the species overlapped and nested, when seen under the perspective of the habitat structure and composition. The differences observed between the sizes of the ellipses suggest that the Neotropical otter is more generalist in terms of the habitat features and the used mosaic when compared to the giant otter. Data available about the diet of Neotropical and giant otters, sympatric in the Pantanal and for the study region, also shows that the former is more generalist than the later, but overlapping the food axis of the niche. One explanation for the possible reduction of potential interactions in the study area is that the Pantanal is characterized by a massive primary production, caused by the flood pulse, which result and can support high densities of animals (Junk and Silva, 2000), including fishes. The food overlap observed for all seasons is expressive (Ojk > 0, 97), with the differences mainly associated to habitat use.
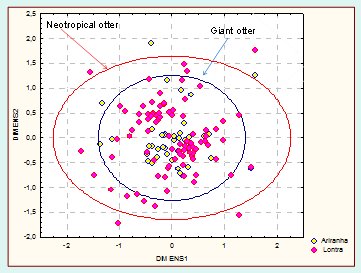 |
| Figure 3. Ellipses delimiting the confidence interval of 95% of the distribution of NMS scores values to the giant and Neotropical otter. Click for larger image |
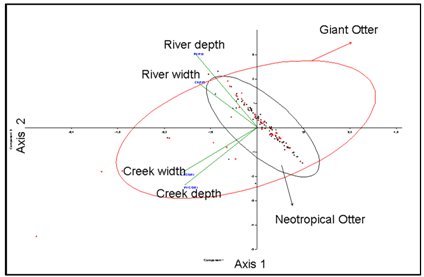
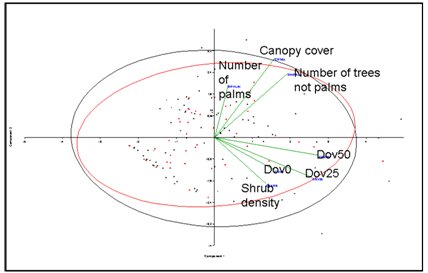
The main differentiation between species is related to water body’s features (Fig. 4) as river and creeks depth and width. Habitat features as slope of banks appear to have low relevance, as other variables associated to the margins of the water bodies (Fig. 5) as palm forests, canopy cover, shrub density, among other variables. The neotropical otter appears to be associated to deeper and widest water bodies, contrasting to giant otter that appears to be more associated to creeks, suggesting a differentiated use of sites, discriminating patches in the landscape. We did not include data related to the availability of prey (fish) in the evaluated areas as stated in the Methods.
The observed patterns characterizing Neotropical otter as generalist agrees with Quadros and Filho (2001). The structural features of the creeks and river margins conditions do not appear to be important to giant otters, as suggested by Duplaix (1980). The partition of space seems to be more related to the landscape peculiarities (presence of large rivers and creeks). The differences between L. longicaudis and P. brasiliensis pointed in this work should be more intensely studied. Both species are of great scenic and ecological value to the Pantanal, additionally to the fact that one of the largest populations of both species coexist in particular conditions. Factors related to the landscape scale may be involved partially in the determination of the observed patterns and must be further investigated. The observed pattern may be a response of landscape features, expressed in local scale that prevents significant interactions between both species, additionally to resource abundance that should minimize competitive exclusion.
ACKNOWLEDGMENTS - This work received support of Earthwatch Institute for which we are very grateful. We wish to thank Helen Waldemarin and Miguel Rico for helping in the Pantanal Otter Project, as well as all volunteers and local workers that helped during the fieldwork activities. We specially thank the Committee of Xth IOC that made my travel to Korea possible to present this research.
REFERENCES
Anoop R., Hussain, S.A. (2004). Factors affecting habitat selection by smooth-coated otters (Lutra perspicillata) in Kerala, India. J. Zool. London, 263: 417-423.
Britski, H. A., Keve Z. de S. de Silimon, and Balzac S. Lopes. (1999). Peixes do Pantanal: Manual de Identificação [Fish of the Pantanal: Manual of Identification]. Brasília: Embrapa-SPI; Corumbá: Embrapa-CPAP.
Carter S., Rosas, F. (1997). Biology and conservation of the Giant otter Pteronura brasiliensis, Mammal Rev., 27: 1-26.
Carrillo-Rubio, E., Lafón, A. (2004). Neotropical river otter micro-habitat preference in West-Central Chihuahua, Mexico. IUCN Otter Spec. Group Bull.,21: 10-15
Chehébar C. (1990). Action Plan for Latin American Otters. In: Foster-Turley, P., Macdonald, S., Mason, C.F. (eds.) Otters: An Action Plan for their Conservation. In: Otter Specialist Group/ IUCN. 126pp.
Duplaix N. (1980). Observations on the ecology and behavior of the Giant river otter Pteronura brasiliensis in Suriname. Rev. Ecol. (Terre Vie), 34: 496-617.
Foster-Turley, P., Macdonald S., Mason, C.F. (1990). Otters: An Action Plan for their Conservation. Otter Specialist Group/IUCN, 126pp.
Gotelli, N.J., Entsminger, G.L. (2006). EcoSim: Null models software for ecology. Version 7. Acquired Intelligence Inc. & Kesey-Bear. Jericho, VT 05465. [http://garyentsminger.com/ecosim.htm]
Groenendijk, J. (1998). A review of the Distribution and Conservation status of the Giant otter (Pteronura brasiliensis), with Special Emphasis on the Guayana Shield Region. Netherlands Committee For IUCN, Amsterdam.
Groenendijk, J., Hajek, F., Duplaix, N., Reuther, C., Damme, P., Schenck, C., Staib, E., Wallace R., Waldemarin, H., Notin, R., Marmontel, M., Rosas, F., Mattos, G., Evangelista, E., Utreras, V., Lasso, G., Jacques, H., Matos, K., Roopsind, I., Botello, J. (2005). Surveying and monitoring distribution and population trends of the Giant Otter (Pteronura brasiliensis). Habitat, 16: 1 - 100
Hammer, Ø., Harper, D., Ryan, P. (2001). PAST: Paleontological Statistics software package for education and data analysis. Palaentologia Electronica 4: 1 - 9
Hutchinson, G. (1981). Introducción a la ecologia de poblaciones. Blume ecología. Barcelona 492pp.
IUCN (2007). 2007 IUCN Red List of Threatened Species.
[http://www.iucnredlist.org. Downloaded on 10 September 2007]
Junk, W., Silva, C. (2000). O conceito do pulso de inundação e suas implicações para o Pantanal de Mato Grosso. Anais do II Simpósio sobre Recursos Naturais e Sócio-economicos do Pantanal. Manejo e Conservação.Corumbá, MS.
Kruuk, H. (2006). Otters: Ecology, Behavior and Conservation. Oxford University Press, NY, 261pp.
Kruuk, H., Moorhouse, A., Conroy, JWH., Durbin, L., Frears, S. (1989). An estimate of numbers and habitat preferences of otters Lutra lutra in Shetland, UK. Biol. Cons. 49: 241-254.
Lourival, R., Harris, M.B.. And Montanbault, J.R., (2000). Introduction to the Pantanal, Mato Grosso do Sul, Brasil. In Willink, PW., Chernoff. B., Alonso. Le Montanbault, Jr. and Lourival, R., Eds, A biological assessment of the aquatic eco-systems of the Pantanal, Mato Grosso do Sul, Brazil. RAP Bulletin of Biological Assessment 18. Conservation International, Washington DC. 205 pp
Morrison, L., Marcot, G., Mannan, W. (1995). Wildlife-habitat relationships, Concepts and Application, Segunda edição. The University of Wisconsin Press, 458 pp.
Morrison, M., Marcot B., Mannan, R. (1992). Wildlife-Habitat Relationships. Concepts & Applications. The University of Wisconsin Press. 343 pp. E.U.A.
Muanis, M. (2004). Giant otter diet analysis in the Pantanal. Friends of Giant Otter Bulletin, 10: 2.
Parera, A. (1996). Las "nutrias verdadeiras"de la Argentina. Boletin Tecnico de la Fundacion Vida Silvestre Argentina 21: 1-38
Pianka, E. (2000). Evolutionary Ecology, 6th Ed. Benjamin Cummings. Addison-Wesley-Longman. San Francisco.
Prenda, J., Granado-Lorencio, C. (1996). The relative influence of riparian habitat structure and fish availability on otter Lutra lutra L. spraining activity in a small Mediterranean catchment. Biol. Cons., 76: 9-15.
Quadros, J., Monteiro-Filho, E. (2001). Diet of the Neotropical otter, Lontra longicaudis, in an Atlantic forest area, Santa Catarina State, Southern Brazil. Stud. Neotropical Fauna Environ., 36: 15-21.
Redford, K., J. Eisenberg. (1992). Mammals of the neotropics (Vol. 2): the southern cone. Chicago, USA: The University of Chicago Press, 430pp.
Schweizer J. (1995). Ariranhas no Pantanal, Ecologia e Comportamento da Pteronura brasiliensis. Edit. Brasil Natureza, Curitiba. 200pp.
StatSoft, Inc. (1999). STATISTICA for Windows [Computer program manual]. Tulsa, OK: StatSoft, Inc., [http://www.statsoft.com]
Waldemarin, H.F. (2004). Lontra longicaudis. In: IUCN 2006. 2006 IUCN Red List of Threatened Species. Downloaded on 10 September 2007.
Résumé : Recouvrement de l’Habitat et des Niches Alimentaires chez la Loutre à Longue Queue, Lontra longicaudis, et la Loutre Geante, Pteronura brasiliensis, dans la Zone Humide du Pantanal, Bresil
Les variables environnementales qui peuvent influencer la présence de la Loutre géante (Pteronura brasiliensis) et la Loutre à longue queue (Lontra longicaudis) ont été étudiées sur la rivière Correntoso du Pantanal au Brésil. Sur ce site d'étude, les deux espèces sont diurnes et principalement piscivores. Les variables descriptives des habitats ont été sélectionnées en fonction de la littérature relative à d'autres espèces de loutres dans le monde et basées sur le jugement des auteurs en utilisant le concept de niche de Gestalt et l'expérience de terrain pour ces espèces. Les analyses statistiques utilisées sont à cadrage multidimensionnel non métriques (SMN) et basées sur la matrice euclidienne des distances et l'analyse des composantes principales (ACP). L’analyse «SMN» a été utilisée pour synthétiser et analyser graphiquement les composantes multidimensionnelles de l’espace qui caractérisent les niches des deux espèces. Les résultats ont montré que la Loutre géante a un plus petit espace écologique et rejoint l'espace de la Loutre à longue queue. L'interprétation écologique est que les loutres à longues queues tendent à être plus généralistes quant à l'habitat utilisé. L’ACP permet d’analyser les différences entre les deux espèces pour un niveau inférieur des variables. Ainsi, les variables ont été regroupées en deux sous-ensembles: l'un avec des variables sur la structure des rives, et l'autre sur les caractéristiques des milieux aquatiques. Les principales différences entre les deux espèces sont exprimées à travers les axes liés aux caractéristiques des milieux aquatiques tandis que les rives semblent présenter moins de différences significatives.
Revenez au dessus
Resumen: Superposición del Habitat y Nicho de Alimentación de las Nutrias Neotropical Lontra longicaudis, y Gigante Pteronura brasiliensis, en la Llanura Aluvial del Pantanal, Brasil
Las variables ambientales que podrían influenciar la presencia de la nutria gigante (Pteronura brasiliensis) y de la nutria neotropical (Lontra longicaudis) fueron estudiadas en el Rio Correntoso, Pantanal, Brasil. En este estudio, ambas especies son diurnas y principalmente piscívoras. Variables descriptivas del hábitat fueron seleccionadas con base en la revisión bibliográfica sobre las especies de nutrias alrededor del mundo, así como en la opinión de los autores basados en el concepto de “niche gestalt” y la experiencia en campo con estas especies. Análisis estadísticos incluyeron escalamiento multidimensional no-métrico (NMS) utilizando matriz de Distancias Euclidianas y el Análisis de Componente Principal (PCA). NMS fue utilizado para analizar el espacio multidimensional de componentes del nicho de ambas especies, así como para resumir gráficamente dicho análisis. Los resultados muestran que la otra gigante tiene un espacio ecológico más pequeño circundado por el espacio ecológico de la nutria Neotropical. La interpretación es que la nutria Neotropical tiene a ser mas generalista en la estructura del hábitat que utiliza. Las variables fueron agrupadas en dos: un grupo con variables relacionadas a la estructura de las orillas y el otro grupo con variables características al cuerpo de agua. La principal diferencia entre las dos especies de nutrias se expresó a través de los ejes relacionados con las características de los cuerpos de agua, la condición de las orillas tuvo aparentemente menor relevancia.
Vuelva a la tapa
