IUCN/SSC Otter Specialist Group Bulletin

©IUCN/SCC Otter Specialist Group
Volume 40 Issue 1 (January 2023)
Citation: Palazón Miñano, S. (2023). Results of the Fourth Eurasian Otter (Lutra lutra) Survey in Spain: 2014-2018. IUCN Otter Spec. Group Bull. 40 (1): 42 - 61
Results of the Fourth Eurasian Otter (Lutra lutra) Survey in Spain: 2014-2018
Santiago Palazón Miñano1
1Otter Group SECEM, European Mink Association, Fauna and Flora Service, Government of Catalonia, Charlie Rivel 35, 08880 Cubelles, Spain.
*Corresponding Author Email: santiago.palazon@gmail.com
Received 18th April 2022, accepted 29th October 2022
Abstract: In the fourth national otter survey in Spain, 8,024 sampling points were carried out covering the entire Spanish mainland. Sampling unit used was the UTM grid (10x10 km). A total of 4,019 cells were prospected, representing 77.3% of the mainland Spain grids. Inside every grid, we made transects of 600 m distance (n=4,822; 60.1%) and spot-check (n=3,202; 39.9%). An overall value of 5,199 locations sampled with a positive presence of otter was obtained, representing 64.8%. Regarding UTM grids, 2,920 were otter positive, where at least one sampling point was found with valid otter traces or signals, representing 76.4% of the cells sampled. Percentage of the territory of mainland Spain with otter was 59.9%. Overall, the results were more positive in the Spain western half than in the eastern one, and more positive in the Spain northern half than in the southern one. By regions, the maximum percentage of positive sampling points and grids was reached in Galicia (north-western Spain), with 95.4% and 96.8% respectively. On the contrary, the minimum values of positive sampling points and grids were obtained in Valencia (eastern Spain), with 15.0% and 20.7% respectively. In relation to the third survey (2004-2006), otter has continued its spread, more slowly than a decade before, and mainly on Mediterranean basins. The numbers and percentages indicate a similar otter distribution in the 2000s and 2010s decades. In several territories, some cells with otter presence in the third survey were not sampled in the current survey; This fact has reduced the percentages obtained for the presence of otters in Spain.
Keywords: Otter, distribution, survey, Spain, recovery
INTRODUCTION
Eurasian otter (Lutra lutra Linnaeus, 1758) is the species with the widest distribution in the world, and the only one in the subfamily Lutrinae present in Europe. Besides Europe, it inhabits northern Africa, Near East and Asia, including East Russia, Korea, Japan, central Asia, China, Taiwan, southern India, Sri Lanka, Malaysia and Sumatra (Wilson and Mittermeier, 2009; Hung and Law, 2016; Duplaix and Savage, 2018). In Spain, as in the rest of Europe, the subspecies is L. l. lutra (Hung and Law, 2016).
It is an animal perfectly adapted to aquatic life. Its habitat is aquatic ecosystems, from seashore to high mountains. In the Iberian Atlantic Ocean (Galicia, Asturias, south and south-west of Portugal and south-west of Andalusia) otters also use the sea, in the waters of the estuaries, river mouths and also on the most exposed coast, but they prefer areas with fresh water available, with less exposure to waves and with the presence of a wide area of shallow waters and springs (Clavero et al., 2006; Romero, 2006, 2008, 2018); they are less frequent in Mediterranean marine environments (Ruiz-Olmo, 2014; Saavedra, 2002). The most common natural habitats are rivers, streams, lakes, lagoons, marshes and any place with a permanent presence of water. They can also be found in reservoirs, canals, ditches, cisterns, golf course lakes and in other artificial environments (Ruiz-Olmo and Delibes, 1998; Ruiz-Olmo et al., 2005; Pedroso et al., 2007; Duarte et al., 2011; Pedroso, 2012).
The factors that determine habitat use and selection are the potential availability of food (persistence of water, especially important in Mediterranean environments) and shelter (Prenda et al., 2001; Ruiz-Olmo et al., 2005, 2011; Kruuk, 2006). Otters combine the use of reservoirs, where they can access abundant food, with the use of rivers and streams, where they find shelter (Pedroso et al., 2007).
The otter can live in mountain areas, with maximum height reported in the Pyrenees at around 2,400 m altitude, but its presence is scarce from 1,500 m above sea level; it does not usually reproduce above 800-1,000 m (Ruiz-Olmo, 2007). The presence of the otter at altitude requires the availability of sufficient food, the absence of snow and ice that prevent access to water and prey, and the absence of large barriers such as waterfalls and artificial dams in canyons (Ruiz-Olmo et al., 2005).
In Spain, the otter is included in Annex II (Animal and plant species of community interest for whose conservation it is necessary to designate special conservation areas) of Law 42/2007, of December 13, on Natural Heritage and Biodiversity, which is the transposition to Spain of the Habitats Directive (92/43/EEC of the Council), relating to the conservation of natural habitats and fauna and flora. According to Royal Decree 139/2011, of February 4, for the development of the List of Wild Species under Special Protection Regime and the Spanish Catalogue of Endangered Species, the otter is not included in the Spanish Catalogue of Endangered Species, but it is in the List of Wild Species under Special Protection Regime.
The European otter is included in Appendix I of the CITES treaty and according to the IUCN Red List (2015) it is classified as “Near Threatened NT” (Roos et al., 2015). Due to the recovery of the Iberian population in recent years, the IUCN Category of the otter in Spain has become “Least Concern LC” (Blanco, 2007).
Three previous national otter surveys were carried out in Spain (1980s, 1990s and 2000s decades) (Delibes, 1990; Ruiz-Olmo and Delibes, 1998; López-Martín and Jiménez, 2008).
ANIMALS, MATERIALS AND METHODS
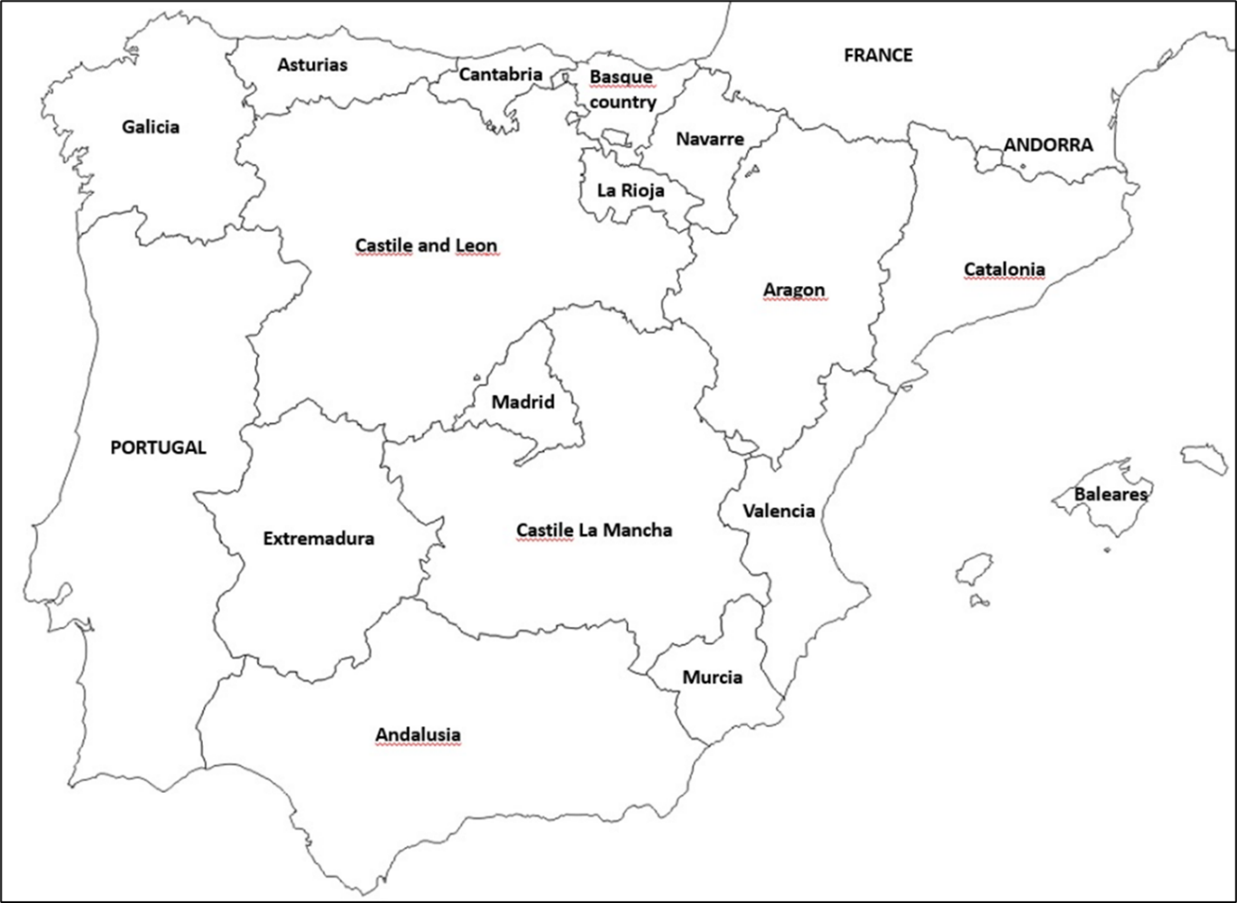
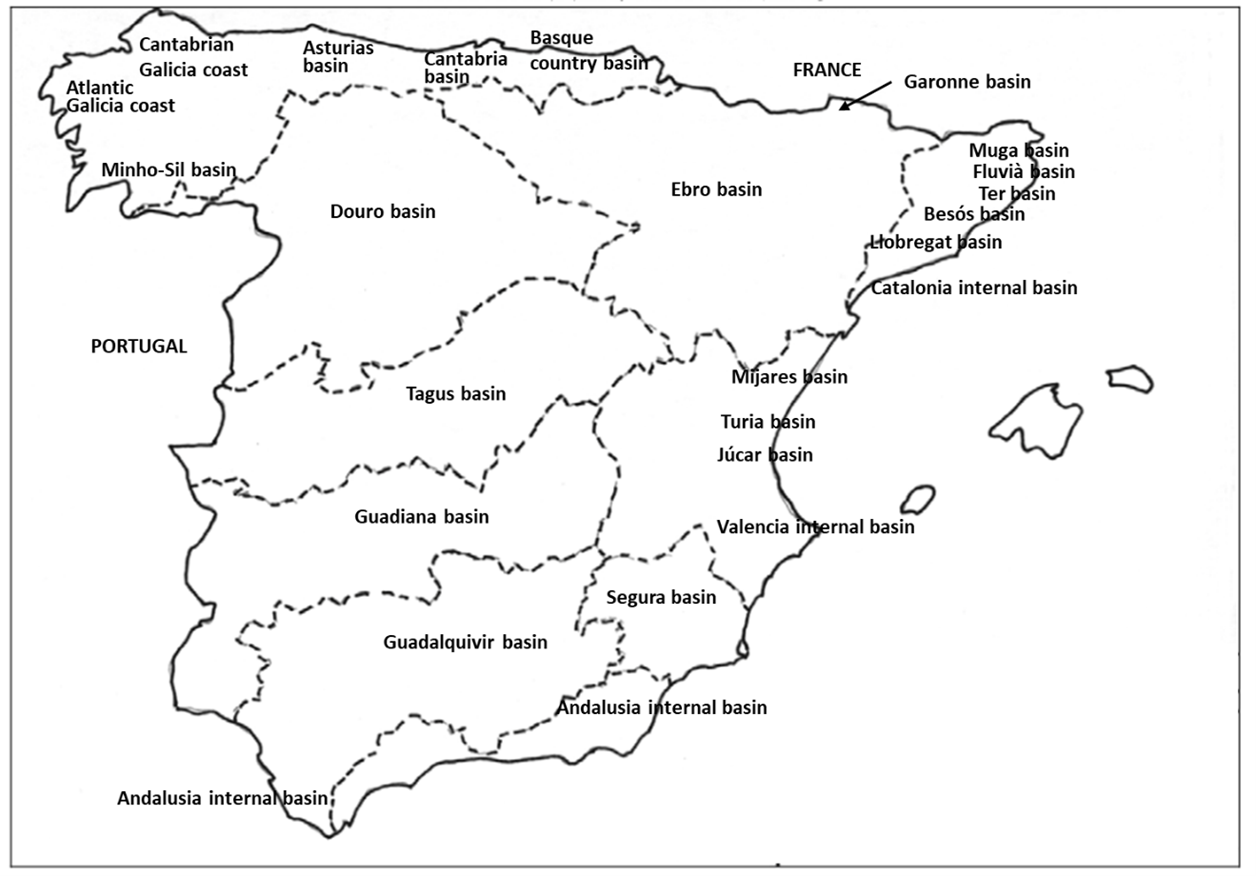
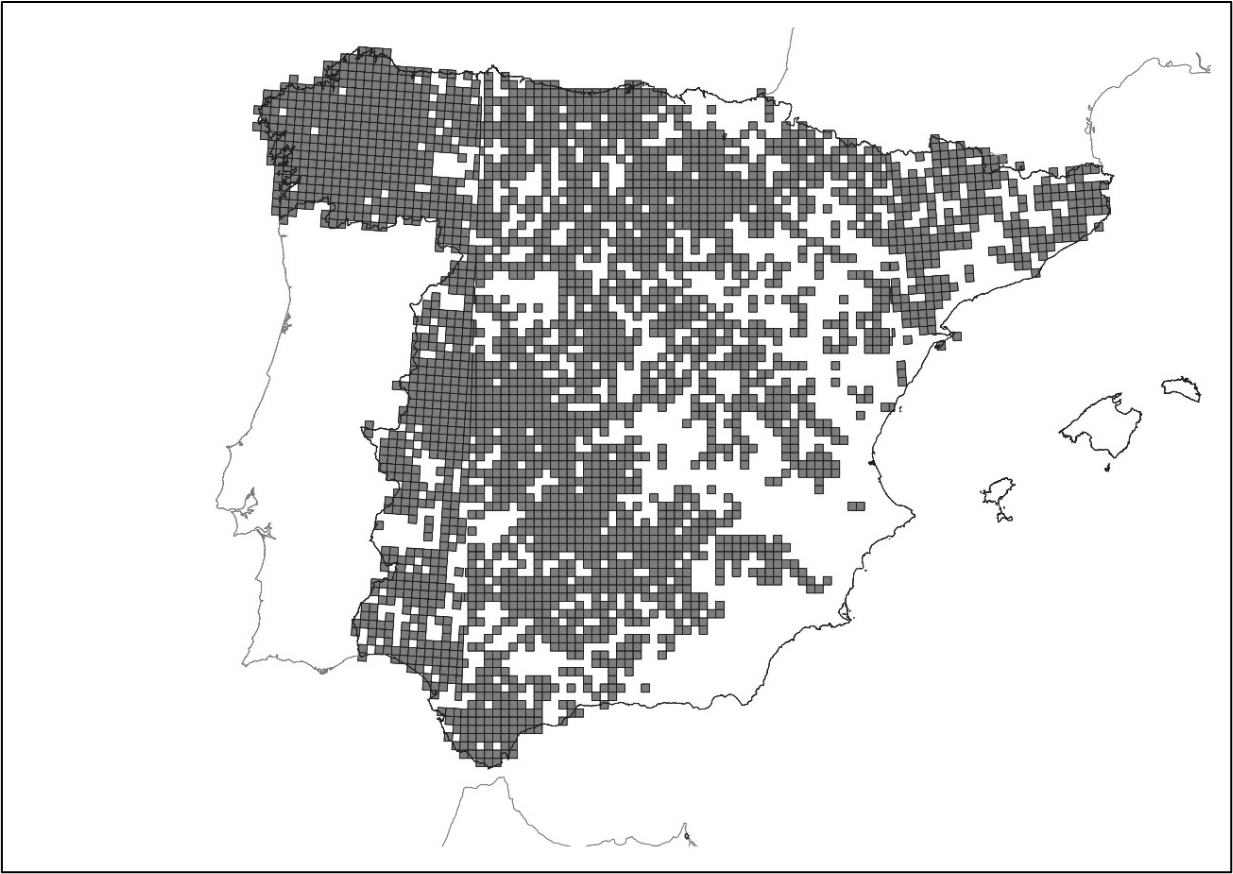
From 2014-2018 we carried out the fourth national otter survey in Spain. We surveyed almost all provinces of peninsular Spain (n=46) on 15 Autonomous Communities and Andorra (Fig. 1); one province was not surveyed, because otter were not found in the three previous Spanish otter surveys (López-Martín and Jiménez, 2008). All Spanish hydrographic basins (Atlantic, Cantabrian and Mediterranean watersheds) were surveyed (Fig. 2). We used, according the recommendation by “Information System for Otter Survey”, the square Universal Transverse Mercator UTM (10x10 km) as sampling unity (Reuther et al., 2002). We surveyed 8,024 sampling points on 3.738 cells (Fig. 3), on a total number of 5,319 UTM cells in Spain (70.3% of cells). We surveyed an average of 2.15 points per cell.
The total number of points surveyed was greater than in former surveys (3,966 in 1984-85, 4,049 in 1994-96 and 5,293 in 2004-06) (López-Martín and Jiménez, 2008). The total number of cells UTM (10x10 km) surveyed was higher than in first and second otter surveys (3,061 in 1984-85 and 2,934 in 1994-96) but a little less than in the third one (4,206 in 2004-06), although in that last survey some squares were counted twice or more times in different territories (López-Martín and Jiménez, 2008).
We carried out two different field surveys. First, and more important, the 600 m itinerary (n=4,822, 60.1%) and second, the spot-check (n=3,202, 39.9%), where a high probability exists to find otter tracks (under bridges, conjunction two rivers, large extensions of mud, etc.) (Chanin, 2003), to complement the first and main prospection. We used the Chi-Square test prove to compare the otter presence among different watersheds and altitudinal bands.
In the fourth Spanish otter survey took part 1,087 collaborators, who surveyed more than 2,280 km of rivers, streams, lakes, pounds, reservoir waters, beaches and coasts.
RESULTS
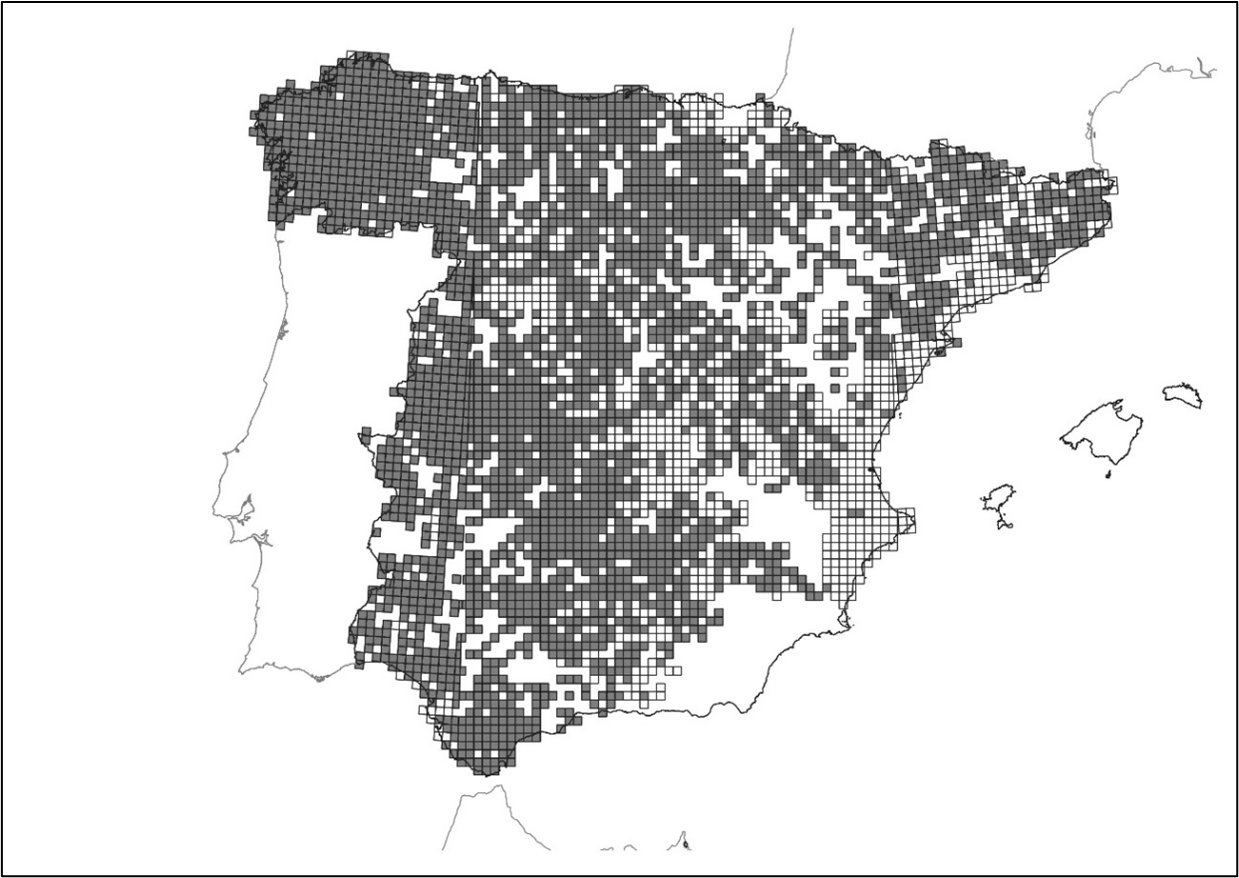
We found 5,199 points with positive presence of otter (64.8%) (Table 1) and 2,920 UTM (10x10 km) cells were positive (78.1% of surveyed cells) (Fig. 4, Table 2). Respect to total cells in mainland Spain (n=5,319), positive squares with otter presence were 54.9%, what was the percentage of peninsular Spanish territory with presence of otter (Table 2). That result was important to compare the otter occupancy of peninsular Spanish territory with three previous national otter surveys.
| Table 2: Results (UTM 10x10 km cells) of fourth otter survey in Spain, by Regions. N1: Cells with 100 km2, N2: Cells with less than 100 km2. | ||||||||
| Regions | UTM (10x10 km) cells | % Otter Territory | ||||||
| N1 | N2 | N Total | N Surveyed1 | % Surveyed | N Positive | % Positive | ||
| Andalusia | 897 | 42 | 939 | 602 | 64.11% | 508 | 84.39% | 54.10% |
| Aragon | 468 | 32 | 500 | 241 | 48.20% | 206 | 85.48% | 41.20% |
| Asturias | 116 | 12 | 128 | 101 | 78.91% | 86 | 85.15% | 67.19% |
| Cantabria | 66 | 0 | 66 | 63 | 95.45% | 56 | 88.89% | 84.85% |
| Castile La Mancha | 835 | 0 | 835 | 709 | 84.91% | 478 | 67.42% | 57.25% |
| Castile and León | 855 | 55 | 910 | 821 | 90.22% | 660 | 81.09% | 76.81% |
| Catalonia-Andorra | 362 | 0 | 362 | 333 | 91.99% | 209 | 62.76% | 57.73% |
| Extremadura | 418 | 50 | 468 | 319 | 68.16% | 315 | 98.75% | 67.31% |
| Galicia | 343 | 0 | 343 | 332 | 97.79% | 322 | 96.99% | 93.88% |
| Madrid | 97 | 0 | 97 | 72 | 74.23% | 56 | 77.78% | 57.73% |
| Murcia | 123 | 0 | 123 | 24 | 19.51% | 18 | 75.0% | 14.63% |
| Navarre | 111 | 0 | 111 | 83 | 74.77% | 71 | 85.54% | 63.96% |
| Basque country | 89 | 0 | 89 | 75 | 84.27% | 43 | 57.33% | 48.31% |
| La Rioja | 61 | 0 | 61 | 58 | 95.08% | 55 | 94.83% | 90.16% |
| Valencia | 268 | 19 | 287 | 276 | 96.17% | 57 | 20.65% | 19.86% |
| SPAIN2 | 5,109 | 210 | 5,319 | 4,1092 | 77.25% | 3,1402 | 76.42% | 59.03% |
| SPAIN3 | 5,109 | 210 | 5,319 | 3,7383 | 70.28% | 2,9203 | 78.12% | 54.90% |
| 1Cells shared by two or more provinces without counting more than once. 2Sum of all regions, counting more than once cells shared by two or more regions. 3 Cells shared by two or more regions without counting more than once. |
||||||||
Results and Analysis by Territories
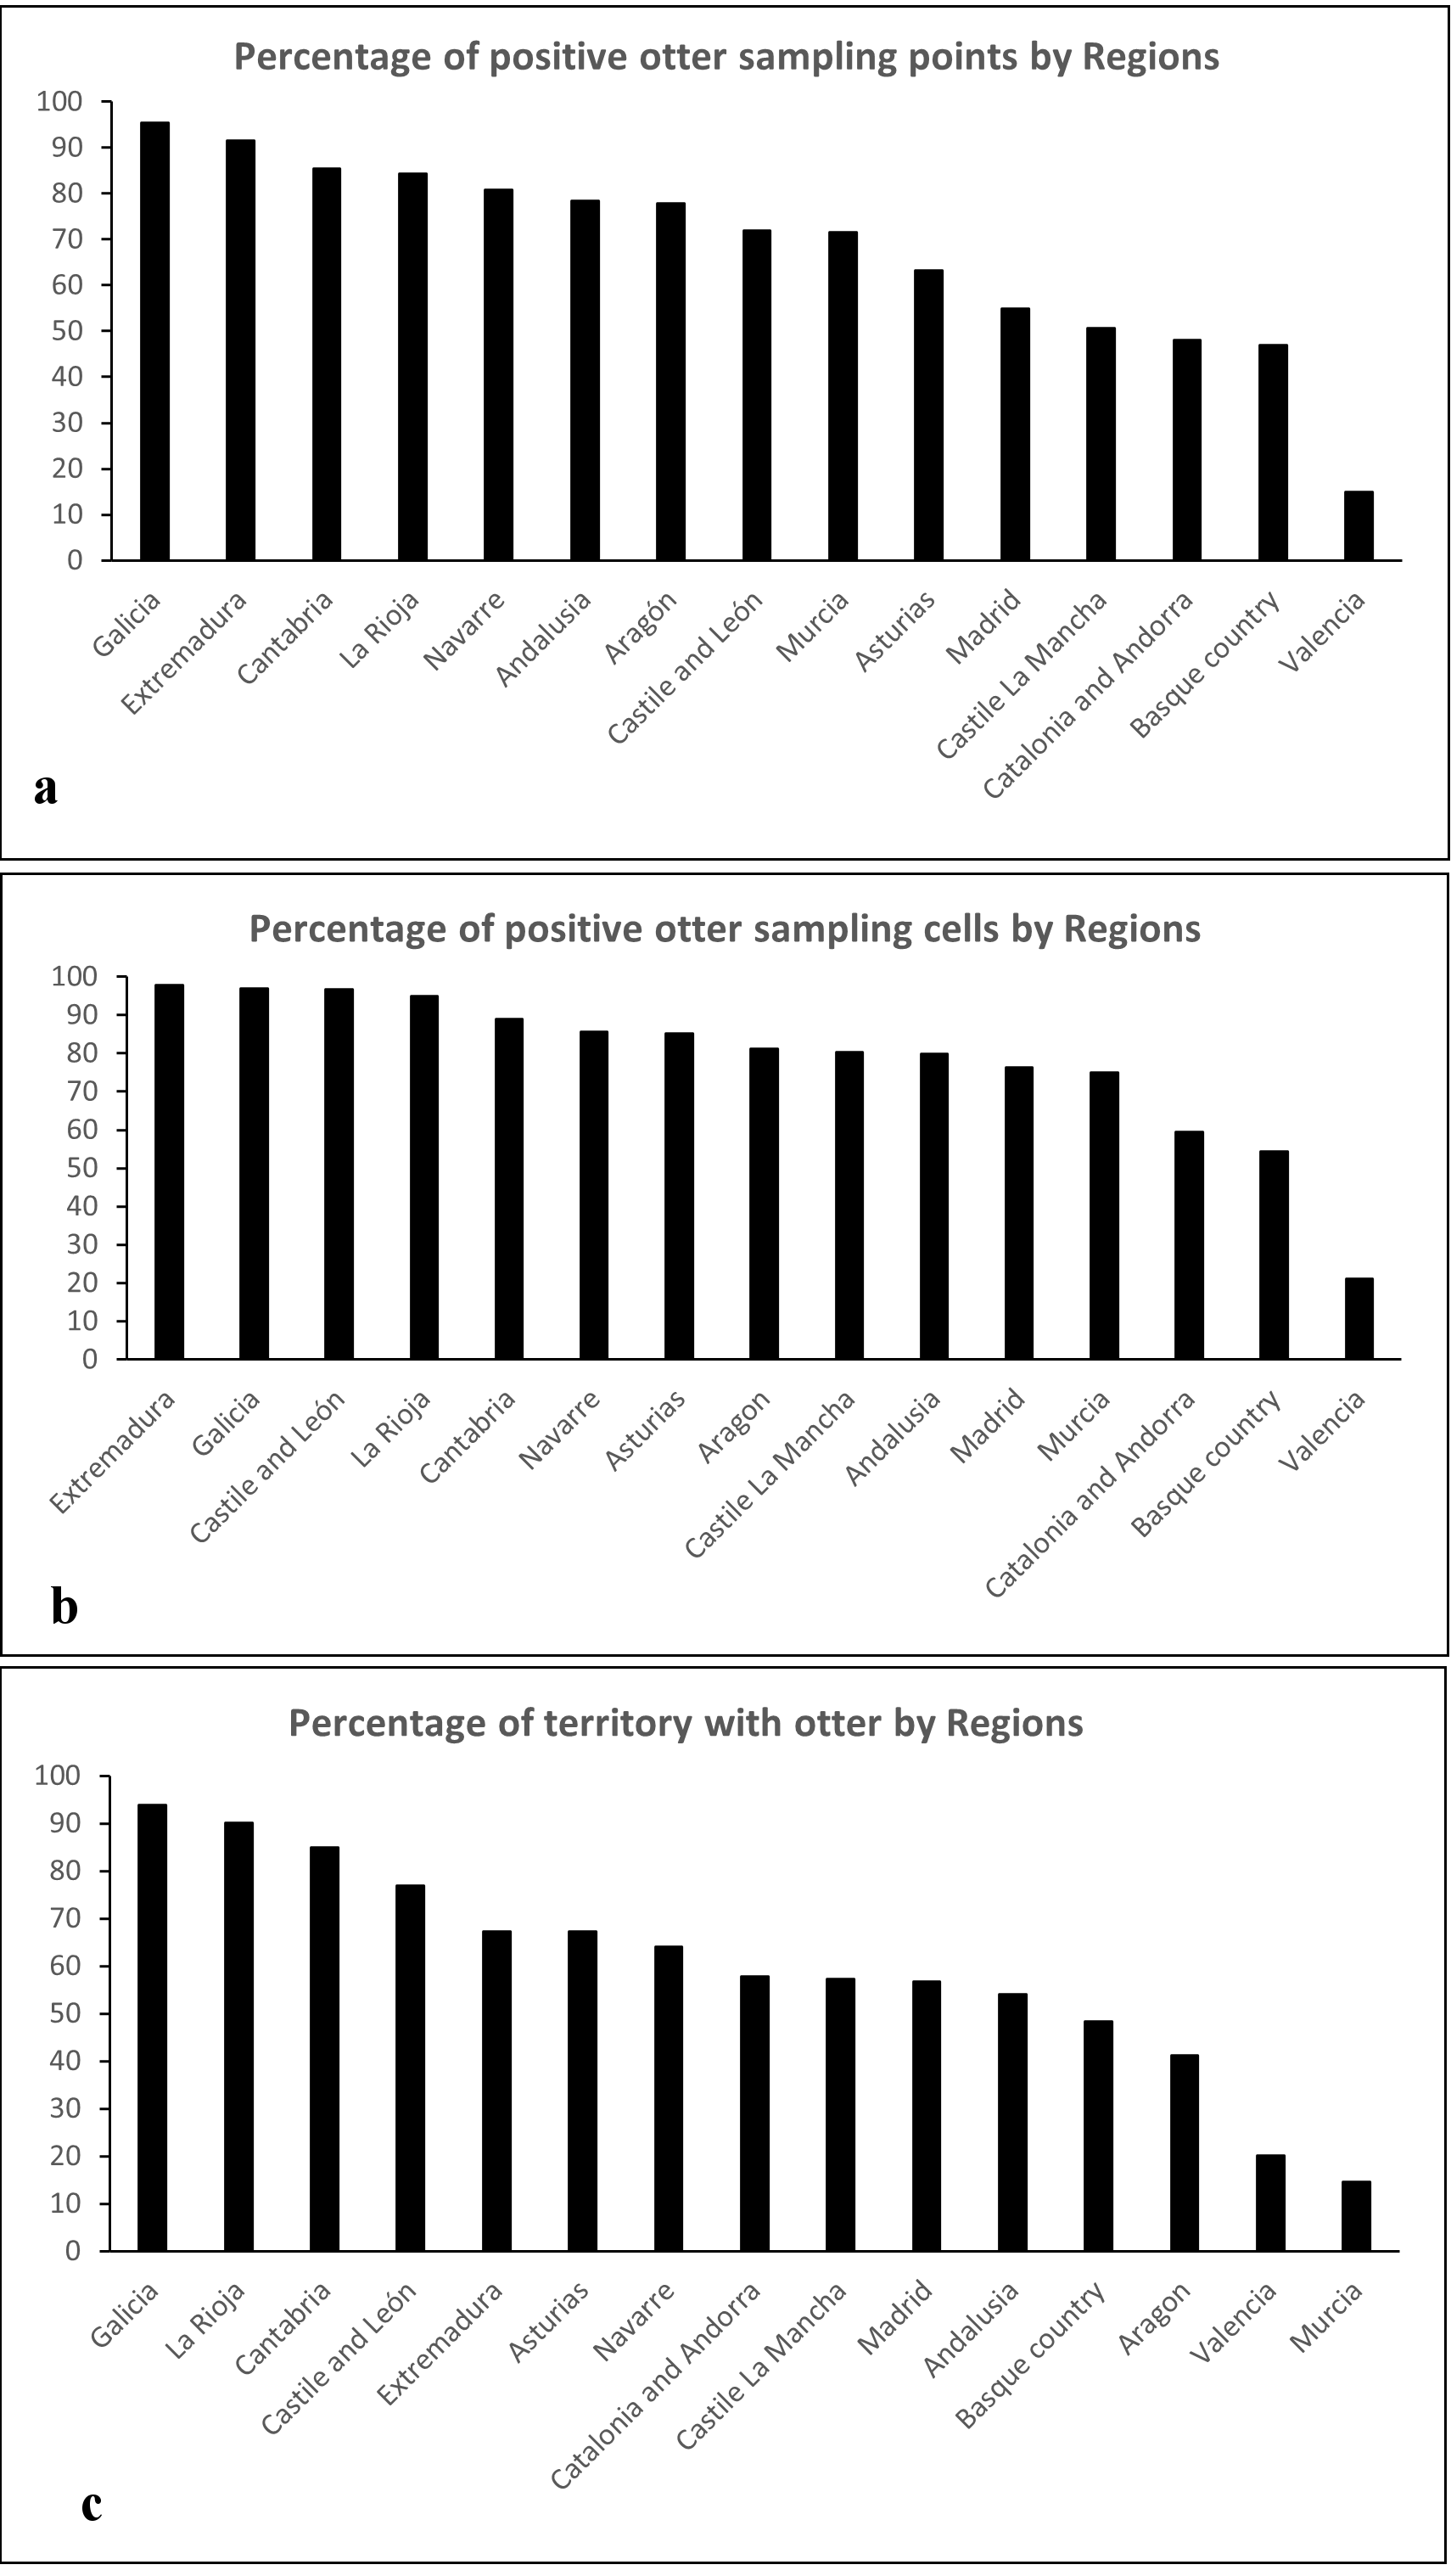
In short, results were more positive in the Western and Northern half than in the Eastern and Southern ones. By regions, maximum percentages of positive points and cells were reached in Galicia (north-west), with 94.1% and 96.8%, respectively (Tables 1, 2 and 3). At the opposite end, minimum percentages were reached in Valencian Community (central-east), with 15.0% and 23.2% respectively (Fig. 5).
Otter presence was detected in all Spanish provinces (n=47), except in one, Almeria, set in the corner south-east of Iberian Peninsula, which not was surveyed (Table 3). The countryof Andorra was included inside the Catalonia region because is a continuation of the same hydrographic basin. The number of points and grids, and the sampling area were greater than in previous surveys. Provinces with the lowest otter presence were Alicante (1.5%), Gipuzkoa (13.3%), Murcia (15.5%) and Biscay (22.2%), counted as a percentage of sampling cells with positive presence relative to the total number of sampling cells (Murcia) and with respect to the sampled grids (Alicante, Biscay and Gipuzkoa) (Table 3).
The second otter survey takes into account 7.7% (n=4,049) dry stream beds, ravines, streams and small rivers. That value increased significantly in the third survey, up to 11.0% (n=4,692) (χ2=27,96; P<0.0001). In the present survey, we counted 253 points on dry stream beds (3.2%, n=8,028), with a significant decreasing from third survey (P<0,0001). We found otter presence in 32 dry streams visited (12.6%).
| Table 3: Results (UTM 10x10 km cells) of fourth otter survey in Spain, by Regions. N1: Cells with 100 km2, N2: Cells with less than 100 km2. | ||||||
| Provinces and Totals for Region | Sampling Points | UTM (10x10 km) cells | ||||
| N | Pos1 | % Pos1 | N | Pos1 | % Pos1 | |
| Almería | 0 | 0 | 0 | 0 | 0 | 0 |
| Cádiz | 125 | 94 | 75.20 | 96 | 77 | 80.21 |
| Córdoba | 222 | 152 | 68.47 | 141 | 118 | 83.69 |
| Granada | 88 | 55 | 62.50 | 60 | 39 | 65.0 |
| Huelva | 135 | 123 | 91.11 | 85 | 81 | 95.29 |
| Jaén | 144 | 101 | 70.14 | 141 | 100 | 70.92 |
| Málaga | 51 | 50 | 98.04 | 44 | 43 | 97.73 |
| Seville | 112 | 112 | 100.0 | 73 | 73 | 100.0 |
| Andalusia | 877 | 687 | 78.06 | 602 | 508 | 84.39 |
| Huesca | 226 | 196 | 86.73 | 110 | 105 | 95.45 |
| Teruel | 125 | 71 | 56.80 | 66 | 45 | 68.18 |
| Zaragoza | 128 | 105 | 82.68 | 78 | 67 | 85.90 |
| Aragon | 479 | 373 | 77.87 | 241 | 206 | 85.48 |
| Asturias | 223 | 141 | 63.23 | 101 | 86 | 85.15 |
| Cantabria | 117 | 100 | 85.47 | 63 | 56 | 88.89 |
| Albacete | 97 | 54 | 55.67 | 63 | 46 | 73.02 |
| Ciudad Real | 294 | 208 | 70.75 | 209 | 162 | 77.51 |
| Cuenca | 337 | 143 | 42.43 | 160 | 92 | 57.50 |
| Guadalajara | 161 | 99 | 61.49 | 111 | 78 | 70.27 |
| Toledo | 377 | 136 | 36.07 | 181 | 111 | 61.33 |
| Castile La Mancha | 1.266 | 640 | 50.55 | 709 | 478 | 74.85 |
| Ávila | 216 | 136 | 62.96 | 88 | 60 | 68.18 |
| Burgos | 219 | 163 | 74.43 | 113 | 105 | 92.92 |
| León | 237 | 231 | 97.47 | 128 | 128 | 100.0 |
| Palencia | 167 | 118 | 70.66 | 83 | 68 | 81.93 |
| Salamanca | 227 | 195 | 85.90 | 96 | 85 | 88.54 |
| Segovia | 121 | 67 | 55.37 | 74 | 50 | 67.57 |
| Soria | 130 | 72 | 55.38 | 71 | 53 | 74.65 |
| Valladolid | 144 | 77 | 53.47 | 70 | 45 | 64.29 |
| Zamora | 253 | 175 | 69.17 | 124 | 93 | 75.0 |
| Castile and León | 1.714 | 1.234 | 72.0 | 821 | 660 | 80.39 |
| Barcelona | 235 | 89 | 37.87 | 79 | 45 | 56.96 |
| Girona | 110 | 63 | 57.27 | 68 | 41 | 60.29 |
| Lleida | 175 | 123 | 70.29 | 111 | 85 | 76.58 |
| Tarragona | 213 | 62 | 29.11 | 85 | 36 | 42.35 |
| Andorra | 42 | 36 | 85.71 | 8 | 8 | 100.0 |
| Catalonia and Andorra | 775 | 373 | 48.13 | 333 | 209 | 62.76 |
| Badajoz | 236 | 227 | 96.19 | 130 | 122 | 93.85 |
| Cáceres | 399 | 354 | 88.72 | 192 | 192 | 100.00 |
| Extremadura | 635 | 581 | 91.50 | 319 | 315 | 98.75 |
| A Coruña | 115 | 111 | 96.52 | 99 | 93 | 93.94 |
| Lugo | 109 | 108 | 99.08 | 102 | 101 | 99.02 |
| Orense | 88 | 81 | 92.05 | 75 | 71 | 94.67 |
| Pontevedra | 75 | 69 | 92.00 | 60 | 60 | 100.0 |
| Galicia | 387 | 364 | 95.35 | 332 | 322 | 96.99 |
| Madrid | 171 | 94 | 54.97 | 72 | 56 | 77.78 |
| Murcia | 67 | 48 | 71.64 | 24 | 18 | 75.0 |
| Navarre | 208 | 168 | 80.77 | 83 | 71 | 85.54 |
| Álava | 192 | 166 | 86.46 | 37 | 35 | 94.59 |
| Gipuzkoa | 158 | 13 | 8.23 | 27 | 6 | 22.22 |
| Bizkaia | 48 | 4 | 8.33 | 15 | 2 | 13.33 |
| Basque country | 398 | 183 | 45.98 | 75 | 43 | 57.33 |
| La Rioja | 147 | 124 | 84.35 | 58 | 55 | 94.83 |
| Alicante | 123 | 1 | 0.81 | 66 | 1 | 1.52 |
| Castellón | 140 | 24 | 17.14 | 83 | 19 | 22.89 |
| Valencia | 297 | 59 | 19.87 | 127 | 37 | 29.13 |
| Valencia | 560 | 84 | 15.0 | 276 | 57 | 20.65 |
| SPAIN | 8,024 | 5,197 | 64.73 | 4,109* | 3,140* | 76.42 |
| 11Pos: positive points. *With no count more than once the squares shared by two or more Regions (N=3,738; Pos=2,920; %pos=78.12). |
||||||
Results and Analysis by Hydrographic Basins
Otters were present in all hydrographic basins of peninsular Spain (Table 4). Otter distribution was significantly higher in the Atlantic and Cantabrian watersheds (69.7% of positive sampling points, n=5,169 surveyed), and lower in the Mediterranean watershed (55.9% of positive sampling points, n=2,855 surveyed) (P<0.0001) (Table 4).
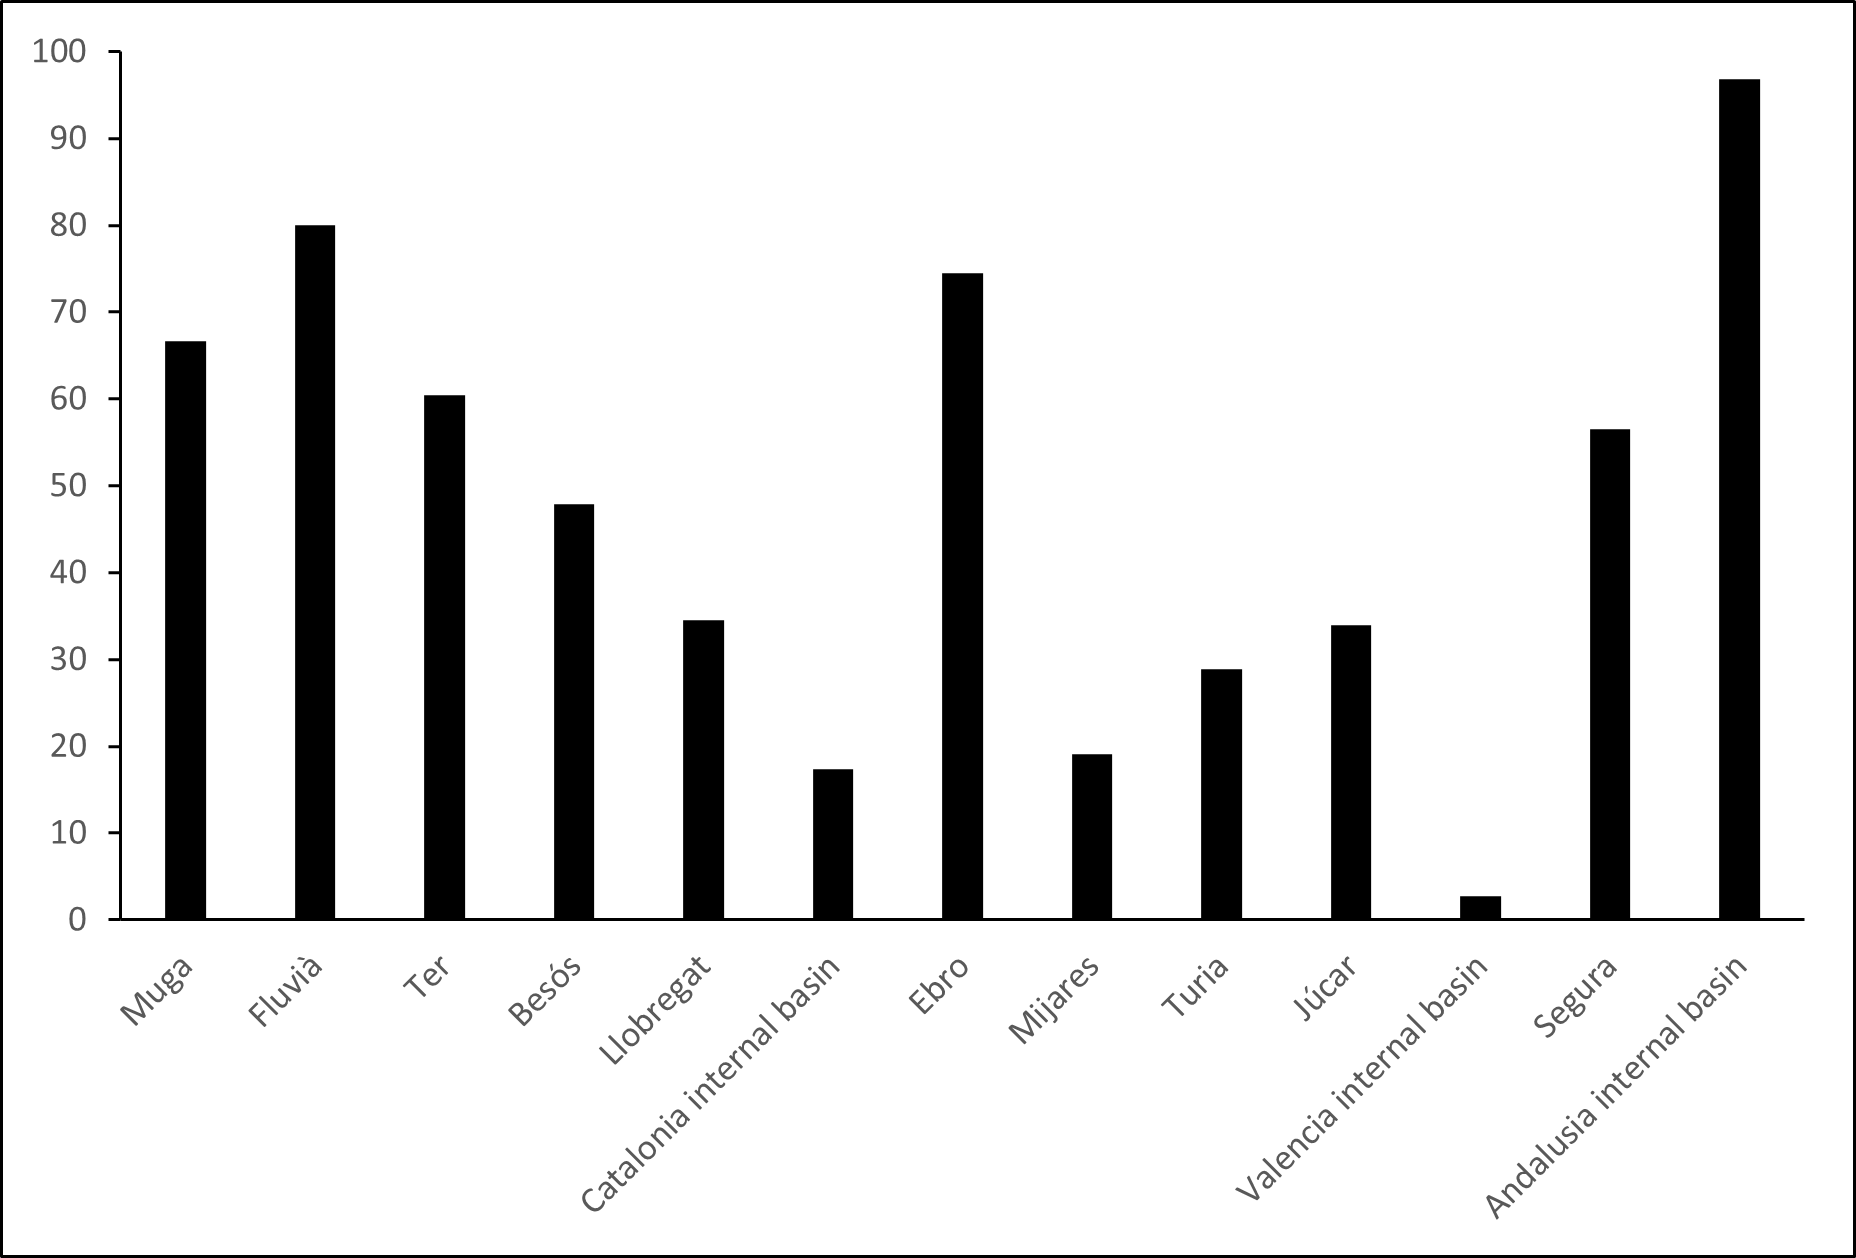
In the Mediterranean watershed, there were strong differences between basins (Fig. 6). From the border with Francein the north-east, to the Gibraltar strait, we describe the otter situation. In the rivers of Girona province, in the north-east corner, there was more than 60% otter presence (Muga: 66.7%, Fluvià: 80.0% and Ter: 60.4%), largely because it is the population resulting from a reintroduction carried out in the second half of the 1990s (Saavedra, 2002). The rest of the basins of Catalonia were below 50.0%, with 17.0% in the small rivers of Barcelona and Tarragona provinces, while the large rivers of Barcelona province (Besós and Llobregat) reached values of 47.9% and 34.5% respectively. The Ebro river basin reached 74.5% presence of otters. The rivers of the Valencian Community were below 30.0% positive samplings, except in Júcar (34.0%), with very low values in the internal basins of that region (2.8%). The Segura river basin presented a percentage of samplings with otters above 56.0%, indicating an excellent recovery, but a very scarce presence in the final stretch, from the city of Murcia. On the other hand, the internal Mediterranean basins of Andalusia (not counting Almería) presented a very high value, 96.8% of otter presence. Otters arepresent in almost all the Mediterranean rivers in the provinces of Granada, Malaga and Cádiz.
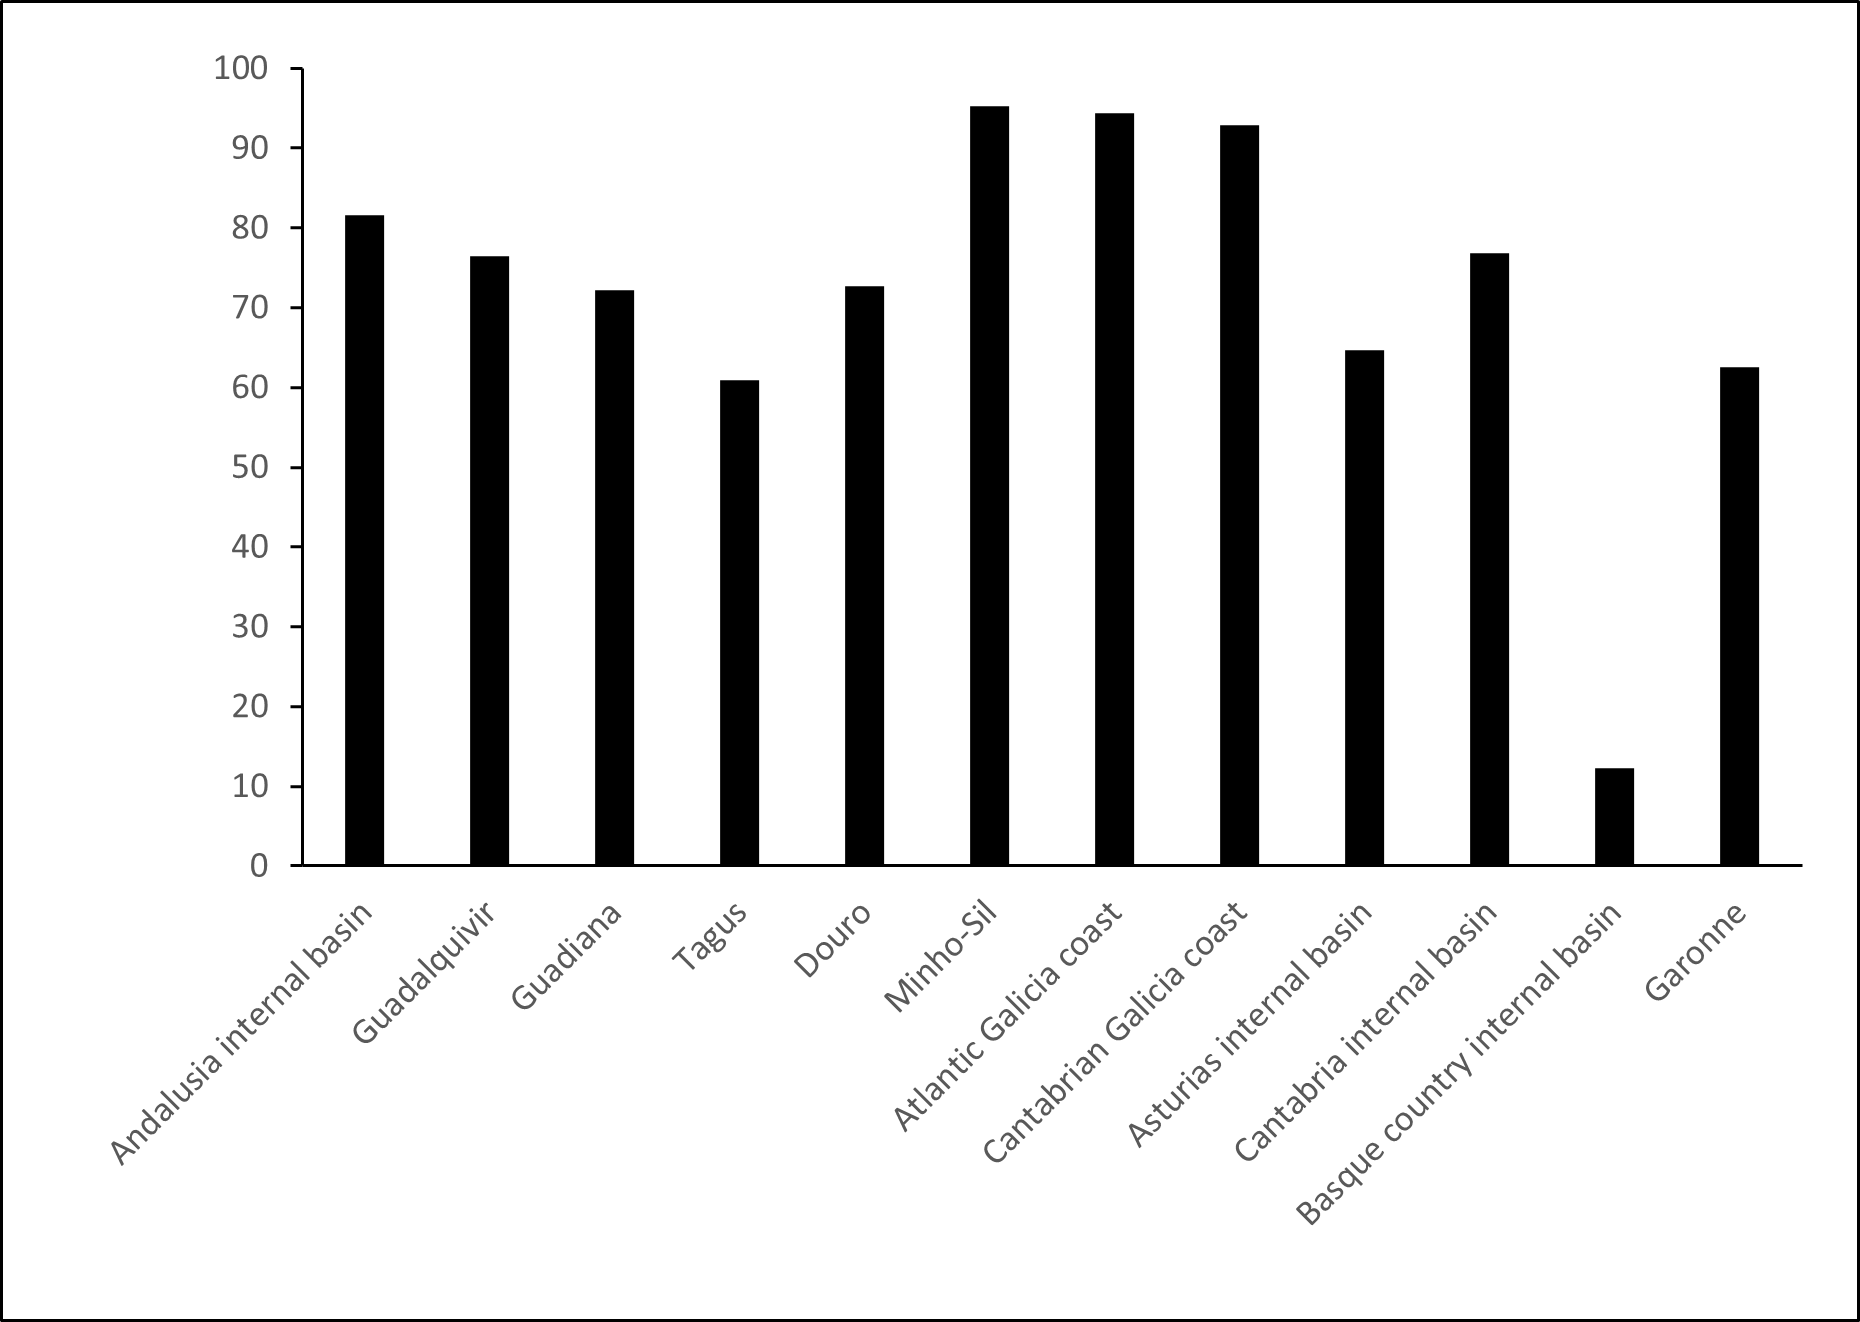
The Atlantic basins, as expected, offered the highest values, with an average 72.5% of otter presence (Fig. 7). From Gibraltar strait to the border with France, northward and then eastward, we describe the otter situation. The Galician coastal basins and the river system of Minho-Sil stood out with 94.4% and 95.3%, respectively. The basin with the lowest percentage of positives was the Tagus River, with only 60.9%. The basins of the Guadalquivir, Guadiana and Douro rivers presented positive sampling percentages above 70.0%. These percentages would probably have been higher if the provinces of Seville (Guadalquivir), Badajoz (Guadiana), Valladolid and León (Douro) could have been be sampled more completely. As in the Mediterranean basin, the internal Andalusian ones of the Atlantic also presented a significant otter presence, with 81.6% (provinces of Cádiz and Huelva).
In the Cantabrian basin, there is a decrease in the presence of otters from west to east, with maximum values of 92.9% in the Galician coastal rivers and minimum values of 12.2% in the Basque country rivers (Fig. 7), next to France. The internal basins of Asturias and Cantabria presented 64.6% and 74.9% of positive samplings, respectively. In addition, in Garonne basin, at its headwaters in the Aran Valley (Catalonia), with a 62.5% positive presence of otters found.
Results and Analysis by Waterbody Typology
In flowing waters (lotic ecosystems, as rivers, streams, channels, irrigation canals, ravines, etc.), the number of surveyed cells was 7,213, with 4,578 positive for otter (63.5%). There were important differences among Cantabrian (49.9%), Atlantic (71.2%) and Mediterranean (55.0%) watersheds (Fig. 8).
In static waters (lentic ecosystems, such as reservoir waters with fixed and variable level, lakes, pounds, pools, lagoons, marshes, etc.), the number of surveyed points was 645, with 508 positive ones in otter (78.7%). Comparing surveys of otter presence, there were also important differences among Cantabrian (n=7; 42.9%), Atlantic (79.7%) and Mediterranean (77.6%) watersheds.
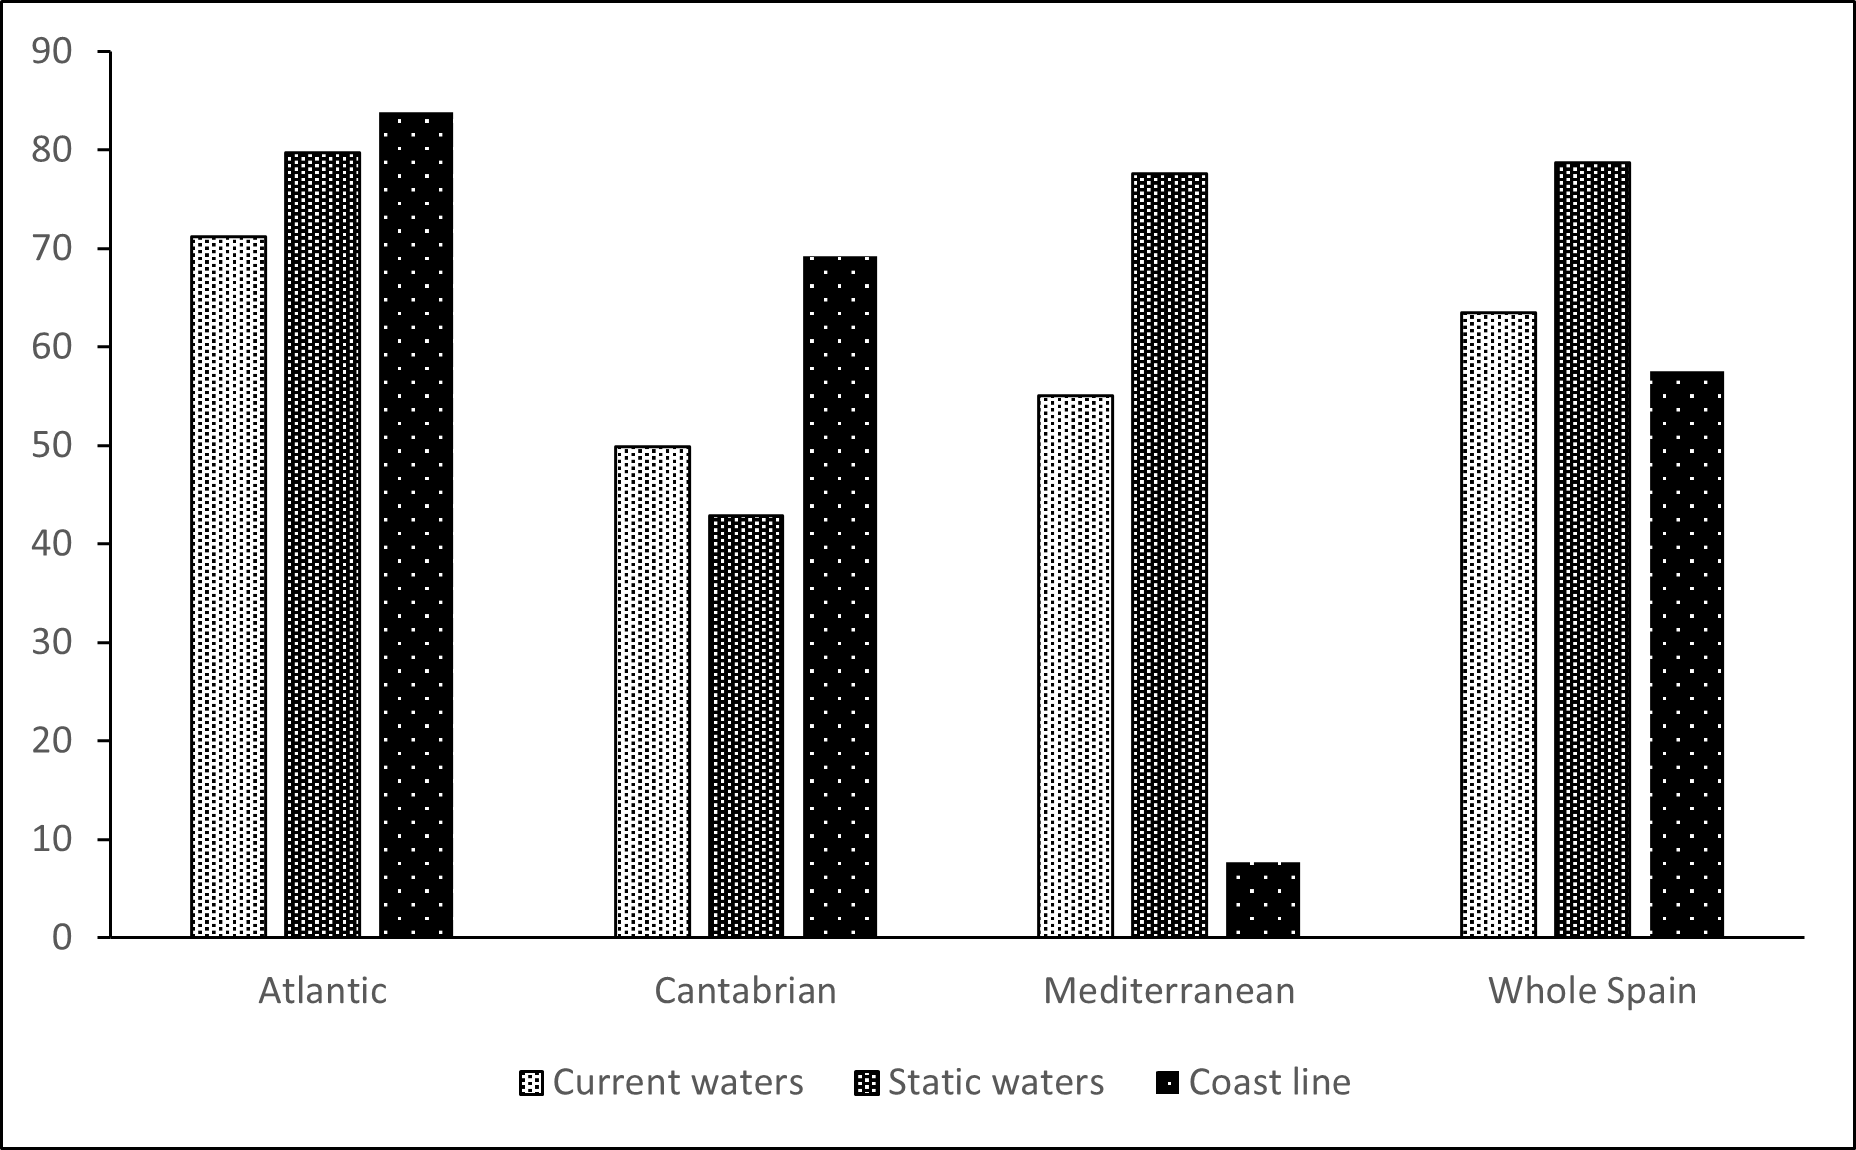
Although otters are more frequent in continental aquatic environments, it occupies the coastline, even using the sea. A total of 120 points was surveyed in littoral areas and coasts, with 57.5% positive (n=69). The positive percentage was 81.5% (n=81 surveys) in Atlantic-Cantabrian watersheds and was 7.7% (n=39 surveys) in the Mediterranean one (P<0,0001).
Along the Mediterranean the otter is present in the marshes “Aiguamolls de l’Empordà” (Girona), in the final stretches of Besós and Llobregat rivers (Barcelona), in the Ebro delta, in the final stretches of Mijares (Castellón), Segura (Alicante) rivers and all rivers of Málaga and Cádiz provinces. On the Atlantic coast of Andalusia, otters are found in the marshes that form the Guadalete (Cádiz), Guadalquivir (Seville), Tinto, Odiel and Guadiana (Huelva) mouths.
On the Galician coast, otters were detected in 49 of 53 coastal samplings (92.5%). In Asturias, otter sign was found just once, in the Eo estuary. In Cantabria, otter sign was found in five points of the Pombo and Oyambre wetlands and the Agoños estuary. With only two coastal records in Basque country, otter sign was found in the Mundaka estuary and the mouth of Plentzia river.
Results and Analysis by Altitude
The highest altitude where otter sign was found, sover 2,000 meters above sea level, were in the Pyrenees (Lleida and Andorra) and the Cantabrian Mountains (Palencia). In Catalonia, otter presence was detected at 2,220 m, inside “Aigüestortes and Sant Maurici Lake National Park”; in Andorra at 2,070 m and in two Palencia lakes at 2,045 and 2,020 m.
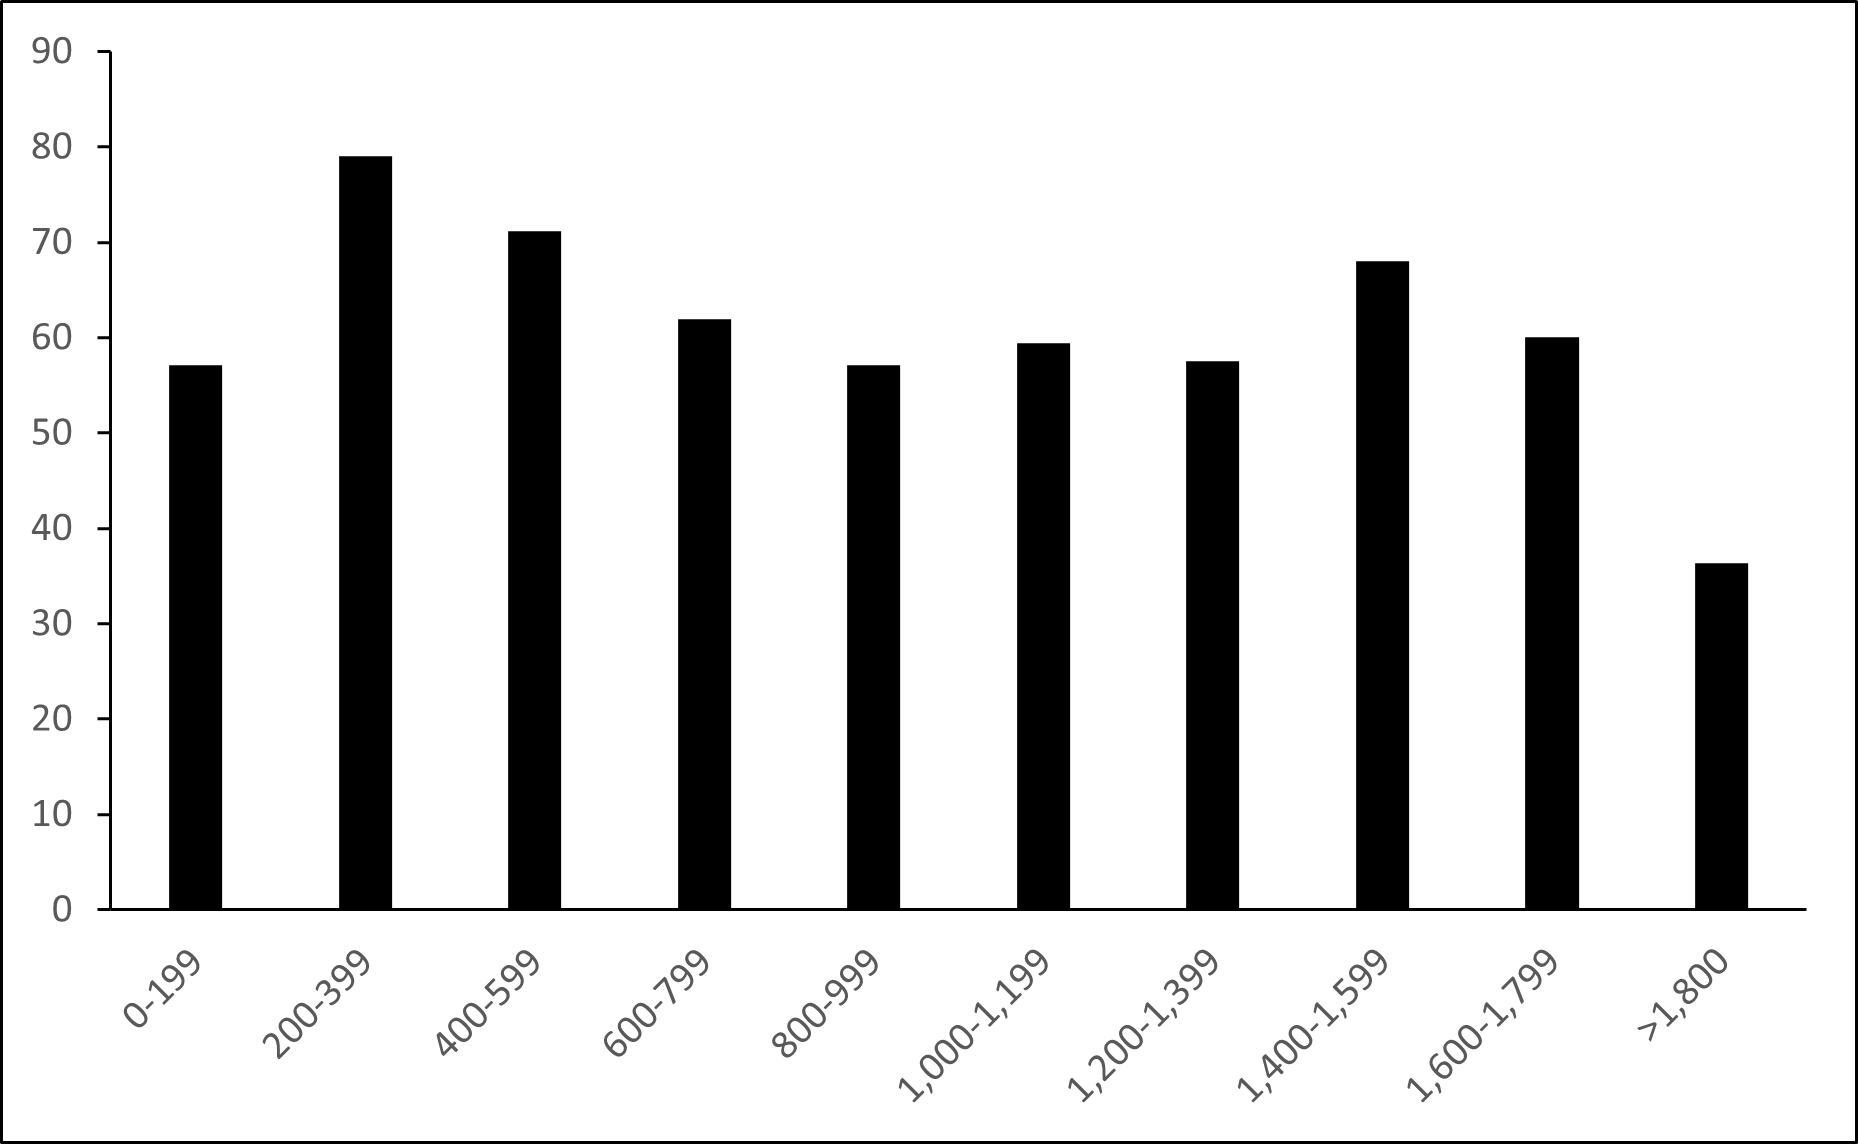
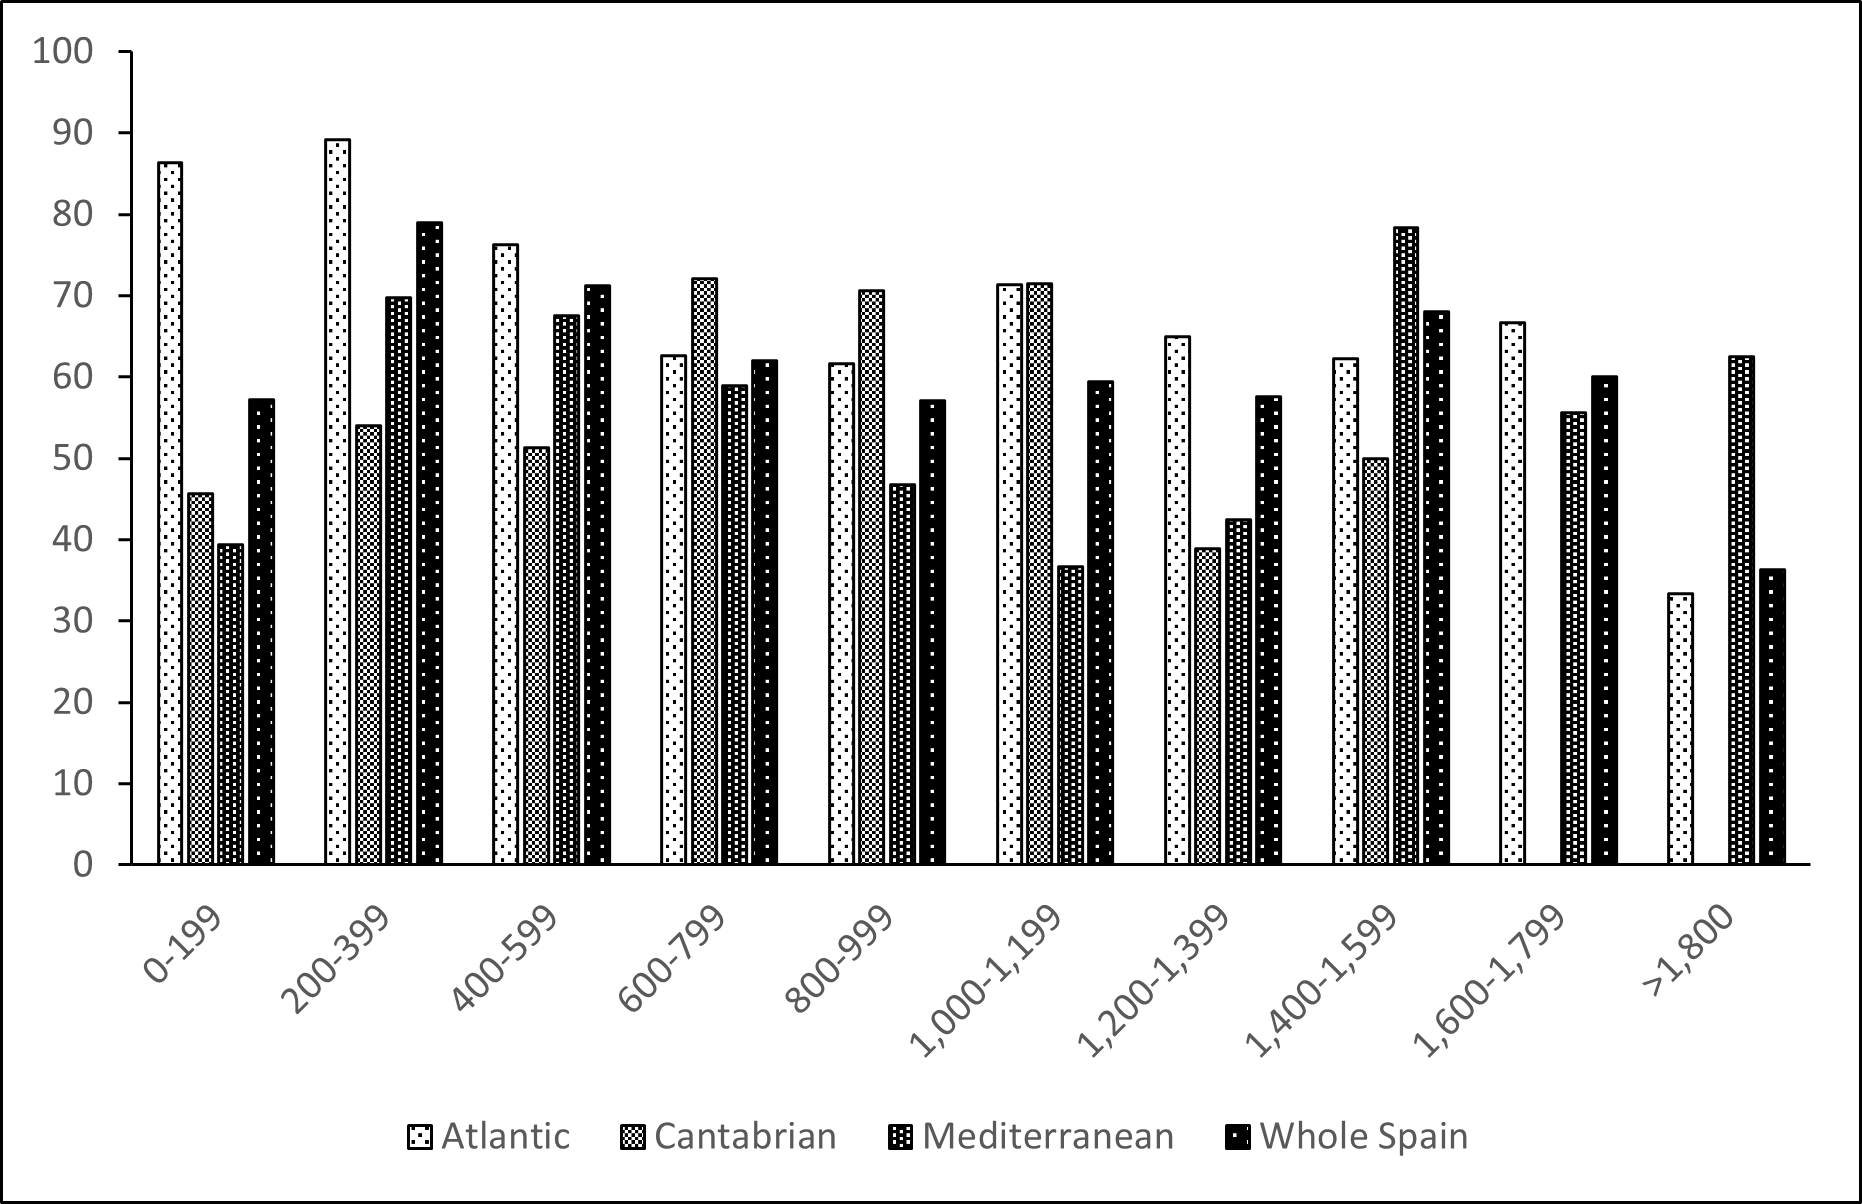
The altitude distribution of otter presence is differs by watershed and altitudinal band. Most percentages of positive sign were between 200 and 400 m altitude (79.0%) and between 400 and 600 m (71.2%). The minimum value was more than 1.800 m (36.4%). The rest of altitudinal bands comprise values between 50 and 65% of positive points (Table 5, Fig. 9). When the altitudinal range of the otter is compared with the presence of otters (percentage of positive samplings) in the three watersheds (Atlantic, Cantabrian and Mediterranean) there were some remarkable differences. In the first three altitudinal bands (from 0 to 599 m) the differences between the three watersheds were significant (P<0.0001 and P=0.0168), with a higher percentage of positive samplings on the Atlantic one (Table 5, Fig. 10). Percentages of sampling points with otters on the Mediterranean watershed are lower in the 0-199 m range and increase considerably between 200 and 599 m. Between 600 and 799 m there were no altitudinal differences between the three watersheds, although the highest percentages of otter presence occurred in the Cantabrian one. Between 800 and 1,199 m, there were statistical differences again (P=0.0082 and P<0.001) ; Cantabrian watershed presented the highest percentages of positive samplings and the Mediterranean the lowest ones. Between 1,200 and 1,399 m, the maximums occurred on the Atlantic watershed, but without being a significant difference. Differences were not found between 1,400 and 1,599 m, but highest percentages of otter presence were found on the Mediterranean watershed. Above 1,600 m of altitude there were not enough samples to compare the three watersheds.
DISCUSSION
Otter Surveys
Since the 1980s, four national otter surveys have been carried out in Spain, each around the middle of decades (1980s, 1990s, 2000s and 2010s) (Delibes, 1990; Ruiz-Olmo and Delibes, 1998; López-Martín and Jiménez, 2008; Palazón, 2021). In some regions, such as Catalonia, Navarre and Valencia, intermediate surveys (Urra and Castien, 2021; Palazón, 2017a; Jiménez and Crespo, 2021) have been carried out. The general trend of the species has been to recover from a critical situation that reached its lowest peak in the 1980s (Delibes, 1990). With the beginning of the new century, the Eurasian otter began to recover in a stable way in a lot of territories where it had disappeared, from its mountain refuges to lower areas. This fourth survey has confirmed the expansion of the species, both in distribution and population growth, which was detected in the third national survey (Jiménez, 2005; López-Martín and Jiménez, 2008; Jiménez et al. 2009).
Few European countries have carried out four or more national otter surveys like Spain. A special case is Great Britain (Wales, England, Scotland, Northern Ireland and the Republic of Ireland) where surveys have been carried out since the late 1970s and early 80s (Strachan, 2015; Crawford, 2003, 2010; Findlay et al., 2015; Reid et al. 2013a, 2013b). Also in some Central European countries, surveys have been carried out over decades; examples are Denmark and Austria (Therkildsen et al., 2020; Kranz and Polednik, 2020) from the 1980s to the present.
Historic threats to Otters in Spain
The causes that led to the near disappearance of otters in many Spanish regions were very diverse. First was the direct persecution of the species; trappers almost wiped out the entire population of some rivers (Ruiz-Olmo, 2014). For instance, of 88 cases of otters killed between 1970 and 1985, 72.7% were killed directly, by shooting or trapping (Jiménez and Delibes, 1990). The large dams built in Spain throughout the 20th century fragmented the otter’s habitat, since some were and are strong obstacles, very difficult to overcome (Jiménez et al., 2008). These large infrastructures force the otters into open urban stretches, crossing roads, swimming in hydroelectric canals, etc., increasing mortality due to predation, or due to being run over in traffic. In addition, large dams decrease the connectivity of the otter population between upstream and downstream, and that of the potential prey (fish) populations from downstream to upstream. Finally, water pollution by phytosanitary and industrial products affected the reproduction and growth of some animals (Ruiz-Olmo et al., 2000).
Recovery of Otters in Spain
The turning point for otter populations recovery was also diverse. Firstly, the total absence of direct persecution. There are no longer any “illegal” trappers (poaching) dedicated to this “trade”, because the otter has been a strictly protected species in Spain since 1973 (Delibes, 1990). For example, of 81 otters killed between 1997 and 2008, none were killed by direct action or human persecution (Jiménez et al., 2009). In addition, the proliferation of Special Conservation Areas (ZEC in Spanish), established according to the EU Habitat and Birds Directive (Natura 2000 network) in the last 20 years in many stretches of rivers, lakes and marshes, have contributed to otter conservation.
Secondly, progressive reduction in the level of contamination of most Spanish riverbeds, mainly due to the start-up of treatment plants and the decrease in phytosanitary products (reduction of organochlorines and PCBs) used in agriculture and residual products (heavy metals) used in industry. The elimination of these bio-accumulative products was very important. The decrease in pollution has also favored the increase in the otter's potential prey, such as fish, and an increase in the biological diversity that inhabits aquatic ecosystems.
The conservation, and in some cases, the improvement of riparian vegetation, especially due to the abandonment and reduction of rural life, have assisted the otter increase. As river habitat has recovered, the otter has been gaining ground and colonizing new stretches of rivers. The proliferation of the red swamp crayfish (Procambarus clarkii) and the signal crayfish (Pacifastacus leniusculus), especially in Mediterranean rivers, acts as a supplementary source of food for otters, especially in times of scarcity as occur in Mediterranean regions in summer. Red swamp crayfish have spread throughout Spain since the early 1980s, followed later by the signal crayfish. In the Segura basin, the otter has gone from consuming native species of fish to preying on non-native species in just 20 years (Dettori et al., 2022). In Asturias rivers, otter preyed on exotic fish such as mountain trout (Salvelinus fontinalis), river bream (Chondrostoma polylepis), minnow (Phoxinus phoxinus) and rainbow trout (Oncorhynchus mykiss) (Palazon, 2021).
The presence of shelter (habitat) and food (fish and crabs) has been and is essential for the recovery of Spanish otter populations. The future of the otter in Spain is favorable. Advances are already known, after this study, in some Mediterranean rivers, reaching the sea and the coast (Jiménez and Crespo, 2021; Palazón, 2021; Ruiz-Olmo, 2014) in Valencia and Catalonia. For instance, the Galicia coast is ideal for otters because of the numerous short rivers with abundant flow, and the topography of the coastline due to the typical Galician estuaries.
Current Threats to Otters in Spain
There are still problems that threaten watercourses and other aquatic areas, such as agricultural intensification, increase of intensive livestock, growth of cities, and the presence of more and more non-native species, especially fish and plants in aquatic systems (Jiménez et al., 2008). The scarcity of water in some river courses in the south and east of Spain is due to periodic episodes of drought and the increasing demands for water by the agricultural (irrigation) and livestock sectors, and human consumption. Water pollution continues, despite the numerous treatment plants that exist throughout Spain. Many of these have become obsolete and they use outdated technology. There are no resources to renew them or for their good maintenance and they allow many pollutants to pass into the rivers. In recent years, chemical pollution from agricultural sources (intensive irrigation) and livestock (macro farms with their nitrogen purines) has increased.
There also continues to be destruction and fragmentation of habitat, especially due to the large infrastructure projects and emergency measures applied by the water management administrations after periodic floods, mainly in Mediterranean rivers, but also in Cantabrian rivers. The presence of construction channels (houses and farms) and crop fields in flood zones creates strong social pressure to “clean dirty rivers”, dredging the beds to make them deeper, cutting or cleaning riparian vegetation, including large trees, building retaining walls or breakwaters, etc. All these actions should be very prompt, only where truly necessary, and very short lived. The natural course of the life of a river, with its periodic floods, make these remedies totally inefficient in the face of the next swelling of the river and the subsequent flood of mainland. More long-term planning and fewer automated responses are needed.
Linked to global warming, water demand for human supply and new irrigation is increasing, leaving water levels very close to the limit. Today, less water passes through Spanish rivers than 30 years ago (Palazón, 2021). This factor will be aggravated in the future, and more efficient water consumption should be promoted to reduce demand and guarantee a minimum ecological flow.
The otter has always shared its habitat with other native mammals, but always as the “apex-predator” of continental aquatic ecosystems. Currently it must also share with the European mink (Mustela lutreola) (since 1950s), American mink (Neovison vison), the coypu (Myoscastor coipu) and the beaver (Castor fiber) (Ruiz-Olmo, 2014; Palazon, 2017b; Palazón and Melero, 2014, 2017; Palazón et al., 2021).
On the banks of the rivers there are poplar plantations, mainly to produce paper. During the felling of these crops, the last 10 meters closest to the riverbed must be protected. Plantations with native species, typical of river groves, with a width sufficient to act as biological corridors, should be encouraged. The presence of natural islands is very important as areas of reproduction, refuge, and protection against human presence.
Road traffic is one of the most important current causes of otter mortality. In Catalonia alone, between 2008 and 2016, 42 otters were run over (Palazon, 2017a, 2021). The improvement of highways, greater density of traffic, modern, fast vehicles, more straight sections where speed limits are exceeded, and roads that run parallel to the riverbeds and that cross several times produce more points or “black sections” where otters and other semi-aquatic mammals are run over. The authorities are trying to correct these problems, but there are very few actions carried out in Spain to prevent otter mortalities.
In recent years there has been greater concern amongst citizens for the conservation of habitats and species. There is greater environmental awareness, surely due to a better dissemination of knowledge, and a closer awareness of natural values, to which global warming and the scarcity of water resources have contributed. The otter has an increasing number of allies who will monitor its presence and take care of the improvement of its habitat.
Otters have been able to occupy areas with a high degree of artificiality, ignoring the proliferation of human presence in the riverbeds or riparian environments. Special cases are the presence of otters in the Manzanares river, in the city of Madrid, and in the Llobregat and Besós rivers, both in the city of Barcelona; both cities are made up of metropolitan areas where more than three million people live (Palazón, 2021).
Since the Third Survey, otters have continued to expand, more slowly, and mainly in Mediterranean areas (López-Martín and Jiménez, 2008). The numbers and percentages indicate a similar distribution of otters to that in the 2000s, but we believe that it is because in some territories a significant number of grids which showed positive presence of otter in the third survey were not sampled in this survey.
CONCLUSION
Otter expansion continues throughout the decade of the 2010, mainly in the direction of the Mediterranean Sea, occupying dry areas with temporal water bodies and where the food is more difficult to get, and occupying areas near to great towns and cities. Otters have yet to arrived on the Mediterranean coast, though the species reached the Atlantic and Cantabrian seashores ten years erlier. Otters are more and more abundant in Spain; the increase of visual observations and road casualties are a consequence of that. Because of this, some regional administrations are considering lowering legal protection of otter. Otter studies in the future should be focused on coexistence between otters, and human and their activities, especially in zones with great industrial activity and high human density.
Acknowledgements: More than 1,080 collaborators have participated in this national survey, besides 10 regional governments, 30 institutions (Universities, Foundations and Associations). The Grupo Global Omnium, Foundation Waters of Valencia financed the publication in Spain of a book. The main regional coordinators of the survey were Javier Palomo, Javier Puente, Antonio Pérez, Benjamín Sanz, Ángel Fernández, Mónica Rodríguez, Javier Cáceres, Francisco García, Jordi Ruiz-Olmo, Javier Prieta, Sara Díaz, Rafael Romero, Alejo Pastor, Íñigo Zuberogoitia, Jorge González-Esteban, Iñaki Galdós, César Aguilar, Asun Gómez, Juan Jiménez and Jorge Crespo.
We all want to regret the death of Rafael Romero in October 2022, a great lover of otters..
REFERENCES
Blanco, J.C. (2007). Estado de conservación de los mamíferos de España. pp. 66-70. In: Palomo, L. J., Gisbert, J., Blanco, J. C. (Eds.). Atlas y libro rojo de los mamíferos de España. Dirección General para la Biodiversidad-SECEM-SECEMU, Madrid. 586 pp.
Chanin, P.R.F. (2003). Ecology of the European Otter. Conserving Natura 2000 Rivers Ecology Series, No 10. English Nature, Peterborough.
Clavero, M., Prenda, J., Delibes, M. (2006). Seasonal use of coastal resources by otters: Comparing sandy and rocky stretches. Estuarine Coastal and Shelf Science, 66 (3-4): 387-394.
Crawford, A.K. (2003). Fourth Otter Survey of England 2000–2002. Environment Agency, Bristol, UK.
Crawford, A.K. (2010). Fifth Otter Survey of England 2009-2010. Environment Agency. Almondsbury, Bristol, United Kingdom. 125 pp.
Delibes, M. (1990). La nutria (Lutra lutra) en España. Serie Técnica. ICONA. Madrid. 198 pp.
Dettori, E.M., Balestrieri, A., Zapata-Pérez, V.M., Palazón, S., Bruno, D., Rubio‑Saura, N., Robledano‑Aymerich, F. (2022). Eurasian otter Lutra lutra diet mirrors the decline of native fish assemblages in a semi-arid catchment (River Segura, SE Spain). European Journal of Wildlife Research, 63: 38. https://doi.org/10.1007/s10344-022-01588-5
Duarte, J., Farfán, M.A., Vargas, J.M. (2011). The use of artificial lakes on golf courses as feeding areas by the otter (Lutra lutra) in southern Spain. IUCN Otter Specialist Group Bulletin, 28 (1): 17-22. https://www.iucnosgbull.org/Volume28/Duarte_et_al_2011.html
Duplaix, N., Savage, M. (2018). The Global Otter Conservation Strategy. IUCN/SSC Otter Specialist Group, Salem, Oregon, USA.
Findlay, M., Alexander, L., Macleod, C. (2015). Site condition monitoring for otters (Lutra lutra) in 2011-12. Scottish Natural Heritage Commissioned Report No. 521.
Hung, N., Law, C.J. (2016). Lutra lutra (Carnivora: Mustelidae) Mamm Species, Volume 48, Issue 940, 30 December 2016, Pages 109–122. https://doi.org/10.1093/mspecies/sew011.
Jiménez, J. (2005). Ecología de la Nutria en afluentes del Ebro sometidos a fuertes fluctuaciones de los recursos. Tesis Doctoral. Universitat de València.
Jiménez, J., Delibes, M. (1990). Causas de la rarificación. In: Delibes, M. (ed.). La nutria (Lutra lutra) en España. Pp. 169-177.
Jiménez, J., López-Martín, J.M., Ruiz-Olmo, J., Delibes, M. (2008). ¿Por qué se está recuperando la nutria en España? In: López, J.M. and Jiménez, J. (eds.), 2009. La nutria en España. 20 años de seguimiento de un mamífero amenazado. Pp. 273-304.
Jiménez, J., Surroca, M., de Chiclana, T., Palomo, J.J. (2009). Colonización de pequeñas cuencas de Castellón por la nutria. Evidencias de saltos entre cuencas. Galemys, 21: 63- 70.
Jiménez, J., Crespo, J. (2021). La nutria en la Comunidad Valenciana. In: Palazón 2021. La nutria en España. 30 años de seguimiento y recuperación de un mamífero amenazado. SECEM. Málaga. 424 pp.
Kranz, A., Poledník L. (2020). Recolonization of the Austrian Alps by otters: conflicts and management. Journal of Mountain Ecology, 13: 31–40.
Kruuk, H. (2006). Otters: ecology, behavior, and conservation. Oxford University Press, New York.
López-Martín J.M., Jiménez, J. (2008). La nutria en España. 20 años de seguimiento de un mamífero amenazado. SECEM. Málaga. 493 pp.
Palazón, S. (2017a). Estat actual i evolució de la distribució de la llúdriga euroasiàtica (Lutra lutra) a Catalunya i Andorra. IV Sondeig nacional de la llúdriga euroasiàtica. Generalitat de Catalunya and Andorra Government. 76 pp.
Palazón, S. (2017b). Visón europeo – Mustela lutreola. In: Enciclopedia Virtual de los Vertebrados Españoles. Salvador A., Luque-Larena J.J. (Eds.). Museo Nacional de Ciencias Naturales, Madrid. http://www.vertebradosibericos.org
Palazón, S. (2021). La nutria en España. 30 años de seguimiento y recuperación de un mamífero amenazado. SECEM. Málaga. 424 pp.
Palazón, S., Melero, Y. (2014). Status, threats and management actions on the European mink Mustela lutreola (Linnaeus, 1761) in Spain: a review of the studies performed since 1992. In: Munibe Monographs. Nature Series; 3, Publisher: Aranzadi Society of Sciences. San Sebastian. Ruiz-González, A., López de Luzuriaga, J. and Rubines, J. (eds.), pp.109-118.
Palazón, S., Melero, Y. (2017). Visón americano – Neovison vison. In: Enciclopedia Virtual de los Vertebrados Españoles. Salvador A., Luque-Larena J.J. (Eds.). Museo Nacional de Ciencias Naturales, Madrid. http://www.vertebradosibericos.org
Palazón, S., Carmona, G., Camps, D., Alguazas, J. (2021). Variables ambientales que condicionan la distribución y el hábitat potencial de cuatro mustélidos en España: visón europeo, visón americano, turón europeo y nutria euroasiática. European Mink Association and Biodiversity Foundation. 100 pp.
Pedroso, N.M. (2012). Otters and Dams in Mediterranean Habitats: a Conservation Ecology Approach. PhD thesis. Universidade de Lisboa. Lisboa.
Pedroso, N.M., Sales-Luis, T., Santos-Reis, M. (2007). Use of Aguieira Dam by Eurasian otters in central Portugal. Folia Zoologica, 56 (4): 365-377.
Prenda, J., López-Nieves, P., Bravo, R. (2001). Conservation of otter Lutra lutra in a Mediterranean area: the importance of habitat quality and temporal variation in water availability. Aquatic Conservation, 11: 343-355.
Reid N., Hayden B., Lundy M.G., Pietravalle S., McDonald R.A., Montgomery W.I. (2013a). National Otter Survey of Ireland 2010/12. Irish Wildlife Manuals, No. 76. National Parks and Wildlife Service, Department of Arts, Heritage and the Gaeltacht, Dublin, Ireland.
Reid, N., Lundy, M.G., Hayden, B., Lynn, D., Marnell, F., McDonald, R.A., Montgomery, W.I. (2013b). Detecting detectability: identifying and correcting bias in binary wildlife surveys demonstrates their potential impact on conservation assessments. Eur. J. Wildlife Res., doi: 10.1007/s10344-013-0741-8
Reuther, C., Dolch, D., Green, R., Jahrl, J., Jefferies, D., Krekemeyer, A., Kucerova, M., Madsen, A.B., Romanowski, J., Röche, K., Ruiz-Olmo, J., Teubner, J., Trindade, A. (2002). Surveying and Monitoring Distribution and Population Trends of the Eurasian Otter (Lutra lutra). Guidelines and Evaluation of the Standard Method Surveys as recommended by the European Section of the IUCN/SSC Otter Specialist Group. Habitat, 12: 1-148.
Romero, R. (2006). La nutria (Lutra lutra L.) en Galicia: Distribución geográfica y ecología trófica de las poblaciones costeras. Tesis Doctoral. Universidade de Santiago de Compostela, Santiago de Compostela.
Romero, R. (2008). La nutria en Galicia. Pp: 143-156. In: López-Martín, J.M., Jiménez, J. (eds.). La nutria en España. Veinte años de seguimiento de un mamífero amenazado. SECEM, Málaga.
Romero, R. (2018). The Recovery of a Coastal Eurasian Otter (Lutra lutra) Population in the Galician Atlantic Islands Maritime-Terrestrial National Park. IUCN Otter Spec. Group Bull., 35 (1): 37–46. https://www.iucnosgbull.org/Volume35/Romero_2018.html
Roos, A., Loy, A., de Silva, P., Hajkova, P., Zemanová, B. (2015). Lutra lutra. The International Union for Conservation of Nature and Natural Resources Red List of Threatened Species 2015. https://ascaris.org/uploads/s/8/e/d/8edzn3y4lrw0/file/xG41XDzh.pdf
Ruiz-Olmo, J. (2007). Influence of altitude on the distribution, abundance and ecology of the otter (Lutra lutra). Pp. 159–176. In: Behaviour and ecology of riparian mammals (Dunstone N., Gorman M.L., eds.). Symposia of the Zoological Society of London 71. Cambridge University Press, New York.
Ruiz-Olmo, J. (2014). Nutria – Lutra lutra. In: Enciclopedia Virtual de los Vertebrados Españoles. Salvador, A., Luque-Larena, J.J. (Eds.). Museo Nacional de Ciencias Naturales, Madrid. http://www.vertebradosibericos.org
Ruiz-Olmo, J., Delibes, M. (1998). La nutria en España ante el horizonte del año 2000. SECEM. Málaga. 300 pp.
Ruiz-Olmo, J., Lafontaine, L., Prignioni, C., López-Martín, J.M., Santos-Reis, M. (2000). Pollution and its Effects on Otter Populations in South-Western Europe. In: Conroy, J.W.H., Yoxon, P., Gutleb, A.C. (Eds.). Proceedings of the First Otter Toxicology Conference, Isle of Skye, September 2000. J. Int. Otter Surv. Fund, 1: 63-82.
Ruiz-Olmo, J., Batet, A., Jiménez, J., Martínez, D. (2005). Habitat selection by female otters with small cubs in freshwater habitats in Northeast Spain. Lutra, 48 (1): 45-56.
Ruiz-Olmo, J., Batet, A., Mañas, F., Martínez-Vidal, R. (2011). Factors affecting otter (Lutra lutra) abundance and breeding success in freshwater habitats of the north-eastern Iberian Peninsula. European Journal of Wildlife Research, 57: 827–842.
Saavedra, D. (2002). Reintroduction of the Eurasian Otter (Lutra lutra) in Muga and Fluvià Basins (NE Spain): viability, development, monitoring and trends of a new population. Tesis Doctoral. Universidad de Girona.
Strachan, R. (2015). Otter survey of Wales 2009-10. Natural Resources Wales. 103 pp.
Therkildsen, O.R., Wind, P., Elmeros, M., Alnøe, A.B., Bladt, J., Mikkelsen, P., Johansson, L.S., Jørgensen, A.G., Sveegaard, S., Teilmann, J. (2020). Arter 2012-2017. NOVANA. Department of Bioscience, Aarhus University. Scientific report from Danish Centre for Environment and Energy, Aarhus University, no. 358. https://dce2.au.dk/pub/SR358.pdf
Urra, F., Castien, E. (2021). Evolución de la nutria (Lutra lutra) en Navarra: 1985-2020. In: Actas del XV Congreso de la SECEM, pp 157. SECEM.
Wilson, D.E., Mittermeier, R.A. eds (2009). Handbook of the Mammals of the World. Vol. 1. Carnivores. Lynx Edicions, Barcelona.
Résumé: Résultats de la Quatrième Campagne de Propection sur la Loutre Eurasienne (Lutra lutra) en Espagne : 2014-2018
Lors de la quatrième enquête nationale sur la loutre en Espagne, 8.024 points d’échantillonnage ont été réalisés sur l’ensemble du territoire espagnol. L’unité d’échantillonnage utilisée était la grille UTM avec des carrés de 10x10 km. Au total, 4.019 carrés ont été prospectés, représentant 77,3 % du réseau de l’Espagne continentale. À l’intérieur de chaque carré, nous avons fait des transects de 600 m de long (n = 4.822 ; 60,1 %) et des vérifications ponctuelles (n = 3.202 ; 39,9 %). Sur l’ensemble des sites échantillonnés soit 5.199, nous avons obtenu des indices de présence positifs dans 64,8 % des cas. En ce qui concerne les carrés UTM, 2.920 étaient positifs pour la loutre, avec au moins un point d’échantillonnage comportant des traces ou des indices de présence de loutre validés, ce qui représente 76,4 % des carrés échantillonnés. Le pourcentage de présence de la loutre sur le territoire de l’Espagne continentale était de 59,9%. Dans l’ensemble, les résultats ont été davantage positifs dans l’ouest de l’Espagne que dans l’est, et davantage positifs dans le nord que dans le sud de l’Espagne. Par région, le pourcentage maximum de points et de carrés d’échantillonnage positifs a été atteint en Galice (nord-ouest de l’Espagne), avec respectivement 95,4 % et 96,8 %. Au contraire, les valeurs minimales des points d’échantillonnage positifs et des carrés ont été obtenues à Valence (est de l’Espagne), avec respectivement 15,0 % et 20,7 %. Par rapport à la troisième campagne de prospection (2004-2006), la loutre a poursuivi son expansion, mais plus lentement que la décennie précédente, et principalement dans le bassin méditerranéen. Les nombres et les pourcentages indiquent une répartition similaire des loutres dans les décennies 2000 et 2010. Dans plusieurs régions, certains carrés UTM positifs lors la troisième campagne, n’ont pas été prospectés dans le présent relevé; Ce fait a pour conséquence de réduire les pourcentages de présence de la loutre en Espagne.
Revenez au dessus
Resumen: Resultados de la Cuarta Encuesta de Nutria Euroasiática (Lutra lutra) en España: 2014-2018
En el cuarto sondeo nacional de nutria en España se realizaron 8.024 puntos de muestreo cubriendo la casi totalidad del territorio español peninsular. Se utilizó como unidad de muestreo la cuadrícula UTM (10x10 km), con un total de 4.019 cuadrículas prospectadas, representando el 77,3% del territorio español. En cada cuadrícula, se realizaron itinerarios de 600 m de distancia (n = 4.822; 60,1%) y puntos “spot-check” (n = 3.202; 39,9%). De todos los puntos muestreados, 5.199 fueron positivos en nutria, representando el 64,8%. De todas las cuadrículas muestreadas, 2.920 fueron positivas, con al menos una localidad con indicios o señales de nutria, representando el 76,4%. Las cuadrículas con nutria fueron el 59,9% de territorio peninsular español. A nivel general, los resultados fueron más positivos en la mitad oeste de España que en la este, más positivos en la mitad norte que en la sur. Por regiones, los máximos porcentajes de puntos y cuadrículas positivas se alcanzaron en Galicia (noroeste de España), con 95,4% y 96,8%, respectivamente. En el lado contrario, los mínimos valores se obtuvieron en la Comunidad Valenciana (este de España) con 15,0% y 20,7%, respectivamente. En comparación con el tercer sondeo, la nutria ha continuado expandiéndose, a un ritmo más lento, principalmente por las cuencas mediterráneas. Los números y los porcentajes indicaron una similar distribución de la nutria en las décadas 2000s y 2010s. En varios territorios, algunas cuadrículas con presencia de nutria en el tercer sondeo no fueron muestreados en el actual sondeo; este hecho ha hecho disminuir los porcentajes obtenidos de presencia de nutria en España.
Vuelva a la tapa

