IUCN/SSC Otter Specialist Group Bulletin

©IUCN/SCC Otter Specialist Group
Volume 36(A) Special Issue (April 2019)
 PROCEEDINGS OF THE 14th INTERNATIONAL OTTER CONGRESS
8 - 19th April 2019
Tangjiahe, China
Monthly Patterns of Scat Marking by River Otters (Lontra canadensis) at Latrines along Pine Creek in Northcentral Pennsylvania, USA
Thomas L Serfass1 , Robert P. Brooks2 and Kelly J. Pearce3
1Department of Biology and Natural Resources, Frostburg State University, Frostburg, Maryland, 21532 USA.. e-mail: tserfass@frostburg.edu (Corresponding author)
2Department of Geography, The Pennsylvania State University, University Park, Pennsylvania 16802, USA (Emeritus). e-mail:rpb2@psu.edu.
3Departments of Environmental Science and Sustainability, and Biology, Allegheny College, Meadville, Pennsylvania, 16335, USA. e-mail:kpearce@allegheny.edu
Received 1st October 2019, accepted 31st December 2019
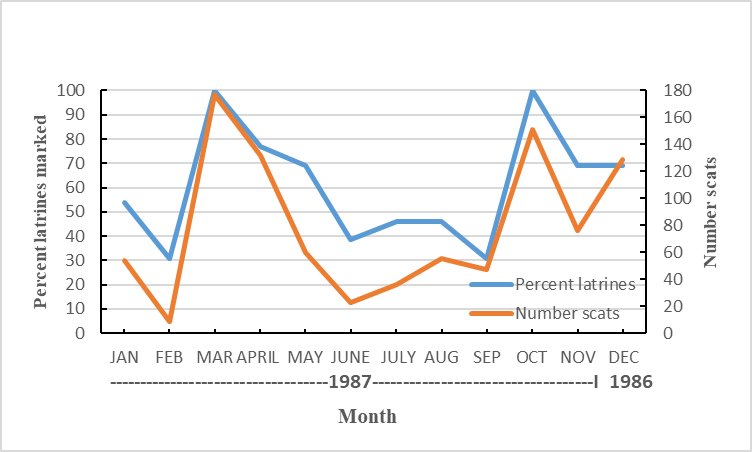
Abstract: Beginning December 1986 through November 1987 we examined monthly patterns of scat marking by North American river otters (Lontra canadensis) at 13 latrines distributed along about a 40 km section of the Pine Creek drainage in Northcentral Pennsylvania. Percentage of latrines marked, scats, and number of scats deposited both varied considerably among months. The percentage of latrines marked by month ranged from 31% (n = 4) in February and September to 100% in March and October. The number of scats counted among months ranged from 74.2 in June to 177 in March. Marking intensity by river otters was highest during March, April, and October through December. Outcomes of this study along with results from a more recent work elsewhere in Pennsylvania suggest that time of year should be an important consideration in designing surveys to detect river otter scats, with portions of spring and fall being the periods when river otters are most actively scat marking at latrines.Keywords: Latrines, Lontra canadensis, Pennsylvania, river otter, scat marking, surveys
INTRODUCTION
In 1982, the Pennsylvania River Otter Reintroduction Project (PRORP) was initiated to restore extirpated North American river otter (Lontra canadensis; hereafter river otter) populations. Overall, PRORP released 153 river otters among 7 discrete riverine systems in central and western Pennsylvania (Serfass et al., 1986; 1993; 2003). As part of the reintroduction effort, 22 river otters were released along the Pine Creek in Northcentral Pennsylvania during 1983 and 1984. Twelve of the reintroduced river otters were monitored by radio-telemetry, with outcomes demonstrating that these individuals had high levels of survival and established home ranges in the general reintroduction areas along Pine Creek (Serfass et al., 1986). In addition to post-release evaluations, another important goal of PRORP was to develop and refine field survey approaches for evaluating the long-term success of the reintroduced populations.
The most common survey approach for determining if otters occupy an area involves walking along shorelines to detect scats, often at latrines (areas of shoreline where otters regularly deposit scats, otherwise scent mark, and socially interact) such as river otters in North America (Swimley, 1998; DePue and Ben-David, 2010) and Eurasian otters (Lutra lutra) in Europe (Kruuk et al., 1986; Macdonald and Mason, 1985). Although generally reliable, latrine surveys are time and labor intensive. To enhance the efficiency of latrine surveys, Swimley et al. (1998) and DePue and Ben-David (2010) developed statistical models in the states of Pennsylvania and Colorado, respectively, that were effective in predicting riparian and aquatic habitat conditions where river otters were most likely to establish latrines. These studies demonstrated that selecting specific habitat conditions prior to a survey effort can enhance detection rates of latrines, but do not consider the potential for seasonal shifts in rates of river otter scat marking rates and associated implications for failing to consider time of year in designing latrine surveys.
Stevens et al. (2011) and Just et al. (2012) demonstrated the general utility of applying elements of models developed by Swimley et al. (1998) to enhance the likelihood of detecting river otter latrines in a variety of riverine habitats near bridges during spring and fall in Pennsylvania, and Just et al. (2012) also demonstrated lower detection rates during summer months. Monthly shoreline surveys conducted by Serfass et al. (2019) in Pennsylvania over the course of a year showed considerable variation river otter scat marking (measured in mean number of scats and latrines per km of shoreline), with peaks during March and April and September through November, and with lowest marking occurring during May through August. The study by Serfass et al. (2019) did not consider the latrine as the primary sampling unit, instead evaluating the number of scats and latrines per km of shoreline (i.e., km of shoreline was the unit of comparison), which was demonstrated to be an effective, although particularly time consuming and labor-intensive approach for monitoring river otter scat marking.
We designed our 1986-87 study to evaluate if scat-marking habits of river otters at specific latrines differed among months over an entire year, and herein re-examine those data considering similar, more recent research on the topic. Specifically, we wanted to determine if the percent of latrines marked with scats and the number of scats deposited at latrines number differed among months. We were particularly interested in re-examining these data to determine if monitoring specific latrines yielded similar results as a more recent evaluation of river otter scat marking along sections of shoreline (Serfass et al., 2019).
STUDY AREA
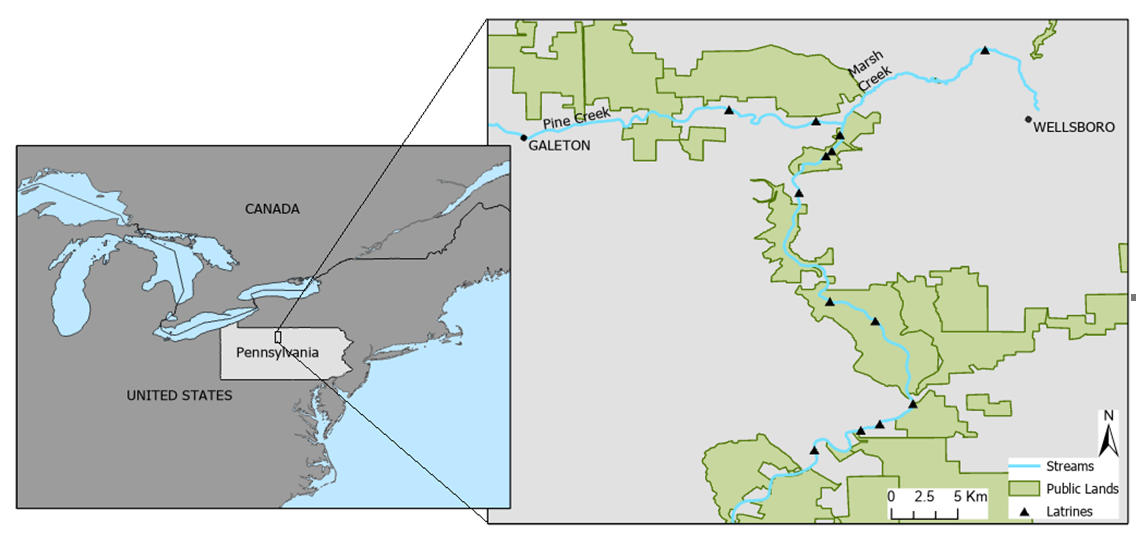
We conducted our study in the Pine Creek drainage in Northcentral Pennsylvania from December 1986 through November 1987 (Figure 1). Pine Creek is the largest tributary of the West Branch of the Susquehanna River, flowing about 125 km from its origin near the town of Galeton to its mouth (Figure 1). A large portion of the Pine Creek drainage in which our study occurred is under public ownership. Most of Pine Creek flows through a steep, narrow valley. Shorelines are generally undisturbed and forested, with numerous large rock formations and elevated, undercut banks, conditions ideal for river otters to establish resting, denning, and latrine sites (Serfass et al., 1986, Swimley et al., 1998). During the period of the study, mean monthly temperatures in the study area ranged from -0.6 to 20.2 °C in January and July 1987, respectively. Mean temperatures were below freezing during December 1986, and January and February 1987. Ice covered portions of the Pine Creek and tributaries during these months in areas where water was slow moving, which may have occasionally limited river otters from accessing some latrines.

Methods
Our study evaluated river otter scat marking at 13 latrines, 12 distributed throughout approximately 40 km of Pine Creek and another on the Marsh Creek, a tributary of Pine Creek (Figure 1). These latrines were among those located during radio-telemetry monitoring of river otter released during 1983 and 1984 (Serfass et al., 1986). During August and September 1986, we revisited latrine sites located during the radio-telemetry study to determine those still actively used by river otters and also conducted walking surveys to locate other latrines in the area known to have been occupied during the radio-telemetry study. The 13 latrines included in the study were dispersed throughout the section of Pine Creek primarily occupied by radio-telemetered otters, were accessible during all seasons by relatively short hikes, and were associated with stream-flow conditions not conducive to freezing (e.g., deep water with relatively high flow rates) so that ice cover would be less likely to impede river otters from accessing latrines.
We visited latrines to count and remove (to prevent recounting) newly deposited scats during the middle and end of each month included in the study. We used descriptive statistics and graphical portrayals to show overall and monthly patterns of scat marking at latrines (hereafter marking) (portrayed as proportions) and the number of scats deposited at latrines (portrayed as means, variation [standard errors {SE}], and ranges). We used “percentage of latrines marked per month,” the “total number of scats counted in a month”, and “mean number of scats deposited at marked latrines (i.e., only those where scats were deposited)” as indices for describing monthly variation in marking intensities.
Results
All 13 latrines were marked during the study, with number of months a latrine was marked ranging from 3 months to 11 months (Median = 8.5). Overall, we counted 965 scats among all latrines, with an annual mean of 80 scats (SE = 13.5; range = 12 - 210) per latrine.
Indices of marking intensity
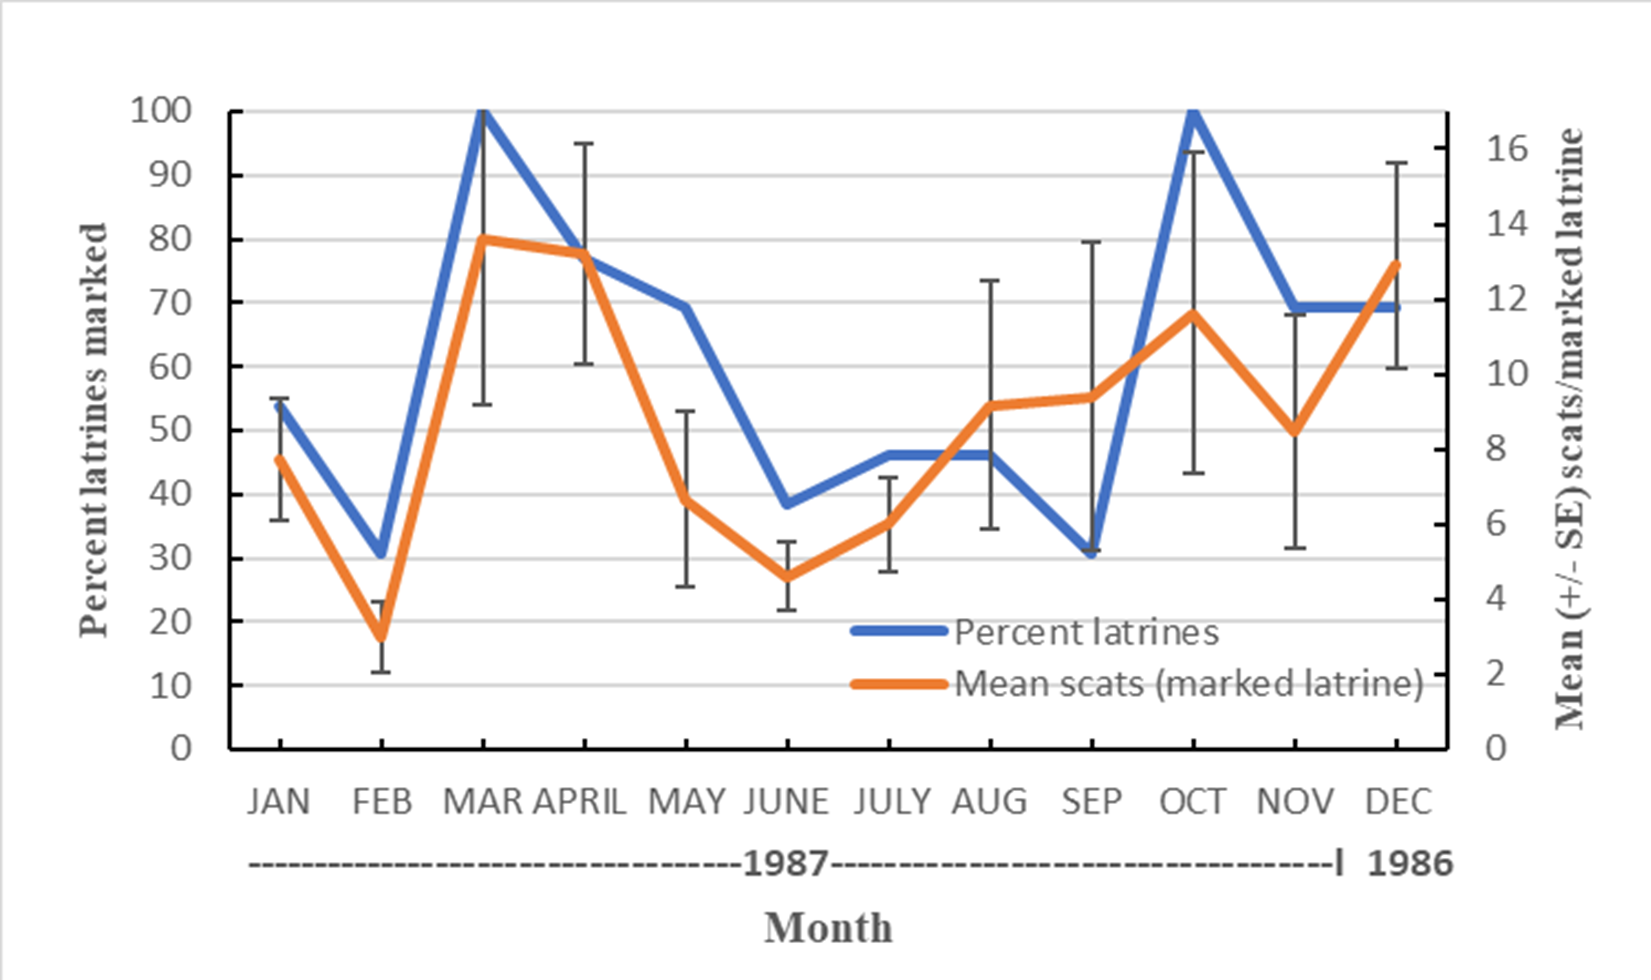
The percentage of latrines marked within a given month ranged from 0.31 (n = 4) in February and September to all latrines (n = 13) in March and October (Figure 2, 3). The mean number of scats deposited among months was 74.2 (SE = 13.5) ranging from 3 in June to 177 in March (Figure 2). The mean number of scats counted per month at marked latrines ranged from 3.0 (SE = 0.9; range = 1–5) in February to (13.6; SE = 4.4; range = 1 – 54) in March (Figure 3). The indices of monthly marking intensity generally followed similar trends, with values peaking during March and April, and to a lesser extent during October through December (Figures 2,3). Although all indices show a general decline in marking intensity from April through June, the decline in percentage of latrines marked and overall scats counted in a month continues through September, whereas mean scats per marked latrines shows a gradual increase beginning in June and continuing through October (Figure 3).


DISCUSSION
Our study revealed seasonal differences in the intensity of river otter scat marking, with peaks in the proportion of latrines marked with scats and average number of scats at latrines highest in months associated with portions of spring (March and April) and fall (October, November, and December). These patterns of scat marking were very similar to those observed in a study that monitored annual river otter scat marking habits along the shoreline (rather than only visiting specific latrines) of Tionesta Creek in northwestern Pennsylvania (Serfass et al., 2019). Through use of remote camera placed at latrines along various riverine habitats in western Pennsylvania and Maryland, Olson et al. (2008) and Stevens and Serfass (2008) likewise demonstrated patterns of river otter visitations to latrines were like patterns observed in our study and by Serfass et al. (2019).
Serfass et al. (2019) speculated that aspects of the river otter’s life history related primarily to the spring breeding season and cub rearing as primary contributors to the observed monthly variation in scat marking. Specifically, Serfass et al. (2019) contend that peaks in spring marking are contributed by males advertising their presence to females, and to other males competing for breeding opportunities; and that the gradual increase in scats per marked latrines beginning in June and the overall peaks in the fall are the result of family groups (female with cubs) more frequently contributing to scent marking. The number of scats deposited in a month closely correspond to the overall percentage of latrines marked during that month (Figure 1). However, the index “scats per marked latrines” considers only latrines that are marked during a particular month. The increase in values for this index might also be explained by dynamics of the family group and associated scat marking. For example, pups initially emerging are likely to be limited in their initial movements but may begin contributing to scat marking at nearby latrines. Likewise, Olson et al. (2005, 2008) postulated that increased, overall scat marking by river otters (for both overall numbers of latrines marked, and numbers of scats deposited) in fall was related to increased movement of the family group along sections of riverine habitats. These contentions could be assessed by extracting DNA from scats collected from the same latrines over the course of the year for identifying individuals and gender of individuals contributing to marking. Based on Olson et al. (2005, 2008), and Serfass et al. (2019), hypotheses that could be assessed by such a genetic approach would predict higher rates of marking by males during spring, and addition of new individuals (pups) contributing to increased marking at specific latrines during summer, progressing into and overall increase in marking by family in the fall (Olson et al., 2008).
Regardless of the cause for the observed monthly fluctuations in river otter scat marking, the outcomes of our study and Serfass et al. (2019) have important implications for the design of scat surveys to determine if river otters occupy an area. Specifically, our study suggests that portions of spring and fall are the most efficacious periods to conduct scat surveys, and that summer and portions of winter, especially January and February, the least suitable times for such surveys to determine presence of river otters. Studies should be conducted in other regions of North America to determine if river otters follow similar patterns of seasonality in scat marking behavior.
Acknowledgements: Financial support for this project was provided by the Pennsylvania Wild Resource Conservation (nongame) Fund (WRCF) and cooperation from the Pennsylvania Game Commission (PGC). We are grateful to assistance and advice provided by Frank Felbaum of the WRCF and Arnie Hayden (deceased) and Jerry Hassinger of PGC.
REFERENCES
DePue, J.E., Ben-David, M. (2010). River otter latrine site selection in arid habitats of western Colorado, USA. J. Wildl. Manag., 74: 1763-1767.
Just, E.H., Stevens, S.S., Spinola, R.M., Serfass, T.L. (2012). Detecting river otter latrines near bridges: does habitat and season influence survey success? Wildlife Biology 3: 264-271.
Kruuk, H., Conroy, J.W.H., Glimmerveen, U., Ouwerkerk, E.J. (1986). The use of latrines to survey populations of otters Lutra lutra. Biological Conservation 35: 187-194.
Macdonald, S.M., Mason, C.F. (1985). Otters, their habitat and conservation in northeast Greece. Biological Conservation 31: 191-210.
Olson, Z.H., Serfass, T.L., Rhodes, O.E. Jr. (2008). Seasonal variation in latrine site visitation and scent marking by nearctic river otters (Lontra canadensis). IUCN Otter Specialist Group Bulletin 25: 109-119.
Olson, Z.H., Stevens, S.S., Serfass, T.L. (2005). Do juvenile Nearctic river otters (Lontra canadensis) contribute to fall scent marking? The Canadian Field-Naturalist 119: 457-459.
Serfass, T.L., Brooks, R.P., Rymon L.M. (1993). Evidence of long-term survival and reproduction by translocated river otters, Lutra canadensis. Canadian Field Naturalist 107: 59-63.
Serfass, T.L., Brooks, R.P., Rymon, L.M., Rhodes, O.E. Jr. (2003). River otters in Pennsylvania, USA: lessons for predator reintroduction. In Conroy, J.W.H., Gutleb, A.C., Ruiz-Olmo, J., Yoxon, G.M (Eds.). Proceedings of the European Otter Conference “Return of the Otter in Europe – Where and how” - Journal of the International Otter Survival Fund, No. 2. IOSF Broadford, Isle of Skye, Scotland (CD-Rom).
Serfass, T.L., Carpenter, C.P., Triska. M.D. (2019). Monthly variation in scat marking by river otters along Tionesta Creek in Northwestern Pennsylvania. Canadian Wildlife Biology and Management 8: 36-44.
Serfass, T.L., L.M. Rymon, J.D. Hassinger. (1986). Development and progress of Pennsylvania’s river otter reintroduction program. Pp. 322-342, In: S.K. Majumdar, Brenner, F.J., Rhoads, A.F., (Eds.). Endangered and threatened species programs in Pennsylvania and other states: Causes, issues, and Management. The Pennsylvania Academy of Science, Philadelphia, Pennsylvania, USA.
Stevens, S.S., Just, E.H., Cordes, R.C., Brooks, R.P., Serfass, T.L. (2011). The influence of habitat quality on the detection of river otter (Lontra canadensis) latrines near bridges. American Midland Naturalist 166: 435-445.
Stevens, S.S., Serfass. T.L. (2008). Visitation patterns and behavior of Nearctic river otters (Lontra canadensis) at their latrines. Northeastern Naturalist 15: 1-12.
Swimley, T., Brooks, R.P., Serfass, T.L., Tzilkowski, W.M. (1998). Predicting river otter latrine sites in Pennsylvania. Wildlife Society Bulletin 26: 836-845.
Modèles Mensuels de Marquage des Epreintes de Loutres de Rivière (Lontra canadensis) liees aux Latrines Situees le long du Pine Creek en Pennsylvanie Nord Centrale, USA
De début décembre 1986 à novembre 1987, nous avons examiné les schémas mensuels de marquage des épreintes par les loutres de rivière (Lontra canadensis) sur 13 latrines réparties dans une section d'environ 40 km du bassin versant du Pine Creek dans la Pennsylvanie Nord Centrale. Le pourcentage de latrines marquées par des épreintes et le nombre d’épreintes déposés varient considérablement d'un mois à l'autre. Le pourcentage de latrines marquées par mois variait de 31% (n = 4) en février et septembre, à 100% en mars et octobre. Le nombre d’épreintes comptabilisées par mois variait de 74,2 en juin à 177 en mars. L'intensité de marquage des loutres de rivière était le plus élevé en mars, avril et d’octobre à décembre. Les résultats de cette étude, ainsi que les résultats d'un travail plus récent dans une autre région de la Pennsylvanie, suggèrent que la période de l'année devrait être un facteur important dans la conception des relevés pour détecter les épreintes de loutre de rivière, avec des périodes au printemps et en automne où les loutres de rivière sont les plus actives dans le marquage des latrines à l’aide d’épreintes
Revenez au dessus
Resumen: Patrones Mensuales del Marcado con Fecas por Parte de Nutrias Norteamericanas (Lontra canadensis) en Letrinas en el Arroyo Pine, Pennsylvania Nor-Central, USA
Entre Diciembre de 1986 y Noviembre de 1987, examinamos los patrones mensuales de marcación con fecas por parte de nutrias norteamericanas (Lontra canadensis) en 13 letrinas distribuidas a lo largo de una sección de 40 km de la cuenca del Arroyo Pine, Pennsylvania nor-central. Tanto el porcentaje de letrinas marcadas con fecas como el número de fecas depositadas, variaron considerablemente entre los messes. El porcentaje de letrinas marcadas por mes varió entre el 31% (n = 4) en Febrero y Septiembre, y el 100% en Marzo y en Octubre. El número de fecas contadas, varió desde 74.2 en Junio a 177 en Marzo. La intensidad de marcado por las nutrias fue más alta durante Marzo, Abril, y de Octubrre a Diciembre. Los resultados de este estudio, junto con los de un trabajo más reciente en otro sitio de Pennsylvania, sugieren que el momento del año debería ser una consideración importante al diseñar monitoreos o relevamientos para detectar fecas de nutrias, siendo los períodos con marcación más activa en letrinas, porciones de la primavera y otoño. of spring and fall being the periods when river otters are most actively scat marking at latrines.
Vuelva a la tapa


