IUCN/SSC Otter Specialist Group Bulletin

©IUCN/SCC Otter Specialist Group
Volume 37 Issue 2 (April 2020)
Citation: Brugger, M., Jährig, M., Peper, J, Nowak, C, Cocchiararo, B, and Ansorge, H (2020). Influence of Eurasian Beaver (Castor fiber) on Eurasian Otter (Lutra lutra) evaluated by Activity Density Estimates in Anthropogenic Habitats in Eastern Germany . IUCN Otter Spec. Group Bull. 37 (2): 98 -119
Influence of Eurasian Beaver (Castor fiber) on Eurasian Otter (Lutra lutra) evaluated by Activity Density Estimates in Anthropogenic Habitats in Eastern Germany
Markus Brugger12, Maik Jährig1, Jan Peper3, Carsten Nowak4, Berardino Cocchiararo, and Hermann Ansorge15
1Senckenberg Museum of Natural History, Am Museum 1, D-02826 Görlitz, Germany Email:: Markus_Fridolin.Brugger@hszg.de
2Department of Ecology and Environment Protection, University of Applied Sciences Zittau/Görlitz, Theodor-Körner-Allee 16, D-02763 Zittau, Germany
3Staatsbetrieb Sachsenforst, Biosphärenreservat Oberlausitzer Heide- und Teichlandschaft, Warthaer Dorfstraße 29, D-02694 Malschwitz, Germany
4Senckenberg Research Institute and Natural History Museum Frankfurt, Conservation Genetics Section, Clamecystraße 12, D-63571 Gelnhausen, Germany
5International Institute Zittau, Technische Universität Dresden, Markt 23, D-02763 Zittau, Germany
(Received 16th April 2019, accepted 9th October 2019)
Abstract: The semiaquatic mammalian species Eurasian beaver Castor fiber Linnaeus, 1758 and Eurasian otter Lutra lutra (Linnaeus, 1758) simultaneously occur in European freshwater ecosystems. Knowledge about the interaction between the two species can be helpful in the prediction of species distribution and colonization. The present study compares beaver and otter activity densities of the winter season 2015/2016 in anthropogenic habitats in eastern Germany. Beaver activity was assessed using tree cuts, otter activity using spraints. The results indicated that otter activity was only slightly influenced by beaver activity (2 % less otter activity for a unit increase in beaver activity, P=0.013), probably because the study area already provides optimal hunting grounds in terms of fish supply for the otter. Additional results obtained from biennial camera trap data, collected between 2015 and 2017, pointed to temporal segregation of the two species during low water periods (P<0.0001). According to our population size estimates for the otter using DNA microsatellite markers and rarefaction, the study area is densely populated by otters (1.46 otters per km river shoreline), whereas the beaver population size, based on identification of territories, indicated suboptimal habitat conditions (1.15 beavers per km shoreline).Keywords: Activity density; Anthropogenic habitats; Camera trap; DNA fingerprinting; Habitat preferences; Interspecific relationship; Population size estimation
INTRODUCTION
Little is known about the interspecific behaviour of the semiaquatic mammalian species Eurasian beaver Castor fiber Linnaeus, 1758 and Eurasian otter Lutra lutra (Linnaeus, 1758) (Ulevičius and Balčiauskas, 1999; Gallant and Sheldon, 2008). Both species simultaneously occur in European freshwater ecosystems. Until recently, however, the otter was intensively pursued mainly due to its role as a fish predator in fisheries, which led to a rapid decline of otter populations all over Europe (Mason and Macdonald, 1986; Klenke et al., 2013). At the same time, beavers were mainly hunted for fur and castoreum, such that they became largely extinct and only survived in small, isolated populations scattered across Europe (Halley, 2011). As a consequence, studies of interaction between beavers and otters were almost unfeasible in Central Europe until mid of the last century. Hence, most of the work available on the topic applies to the North American beaver (Castor canadensis) and the North American otter (Lontra canadensis) (Green, 1932; Tumlison et al., 1982; Melquist and Hornocker, 1983; Reid et al., 1988; Swimley et al., 1999, Collen and Gibson, 2000). If the relationship between the North American beavers and otters also applies to the corresponding Eurasian species, remains unclear. It seems likely, however, that the relationship between the Eurasian species is similar to the one in North America due to the largely comparable way of living and behaviour patterns of Eurasian and North American beavers and the almost identical food preferences of the Eurasian and North American otters (Campbell-Palmer and Rosell, 2015). The relation of C. canadensis and L. canadensis is described as commensal (Tumlison et al., 1982), such that the building activity of the beaver in terms of dams and resulting beaver ponds is considered to have a positive impact on the survival rate, reproductive success, and species diversity of the fish community (Collen and Gibson, 2000). Hence, beaver ponds represent optimal habitats and hunting grounds for the otter due to the increased amount of available fish, which is the otter's main prey (Tumlison et al., 1982). With regard to more direct species interactions, North American otters are occasionally observed sleeping in abandoned beaver lodges (Swimley et al., 1999), peacefully living together with beavers in the same lodge (Melquist and Hornocker, 1983), but also expelling beavers from their lodges to occupy them for their own purposes (Reid et al., 1988). Older works even document an active predation of otters against beavers (Green, 1932).
With respect to the Eurasian species C. fiber and L. lutra, field observations of direct interactions between beavers and otters are inconclusive (see e.g. Semjonow (1951) and Romanowski et al. (2010)). A more quantitative, but indirect approach of studying the interaction is presented in the work by Sidorovich et al. (1996), who found a positive correlation between otter number and beaver settlements in Belarus. However, the correlation depended on river width, such that wider rivers with a larger number of beaver settlements did not entail a proportionally larger number of otters (Sidorovich et al., 1996). Hence, in order to accurately assess the effect of beaver activity on otter presence, otter-specific habitat correlates for the study area need to be identified as potential confounders prior to interaction analysis.
Another way to study activity patterns of elusive species such as beavers and otters are camera traps (Guter et al., 2008; Karamanlidis et al., 2014; Swinnen et al., 2015). The analysis of camera trap data might reveal dissimilarities of activity patterns between beavers and otters, which would indicate temporal segregation, i.e., time shifts in activity peaks (Niedballa et al., 2019), during shore leaves.
Population size estimates provide valuable information as to the population status, especially for such elusive species like beavers and otters, which is helpful to assess the validity of the results gained from statistical analyses that focus on interspecific relationships. Beaver population size is usually estimated by identifying the number of territories based on tree cuts (Schwab and Schmidbauer, 2001). Otter population size can be estimated by DNA fingerprinting (Bruford and Wayne, 1993) using non-invasive genetic sampling of spraints (Kohn and Wayne, 1997).
In summary, the aim of the present study was to compare beaver and otter activity densities by means of correlation analysis and complex regression modelling, including potential confounders for habitat selection and species detectability in an anthropogenic environment in eastern Saxony, Germany, which is populated by beavers and otters. Measures of activity density were defined as weighted sums of either fresh or old tree cuts per river section for the beaver and the absolute number of spraints per river section for the otter (Almeida et al., 2013). Furthermore, we analysed camera trap data gathered for 2 years to evaluate – although limited to a single, but highly frequented land corridor – dissimilarities in activity patterns of the two species. Because there are no current beaver and otter population size estimates available for the study area, we also provided population size estimates for beavers and otters based on the identification of beaver territories and DNA fingerprinting using otter spraints, respectively.
STUDY AREA
The study area comprised the rivers Spree and Lusatian Neisse in Upper Lusatia, Saxony, Germany (Figure 1). It is lowland, with agricultural use mostly close to the riverside and only a few patches of riparian forests. On its way north, the Spree traverses the Upper Lusatian Heath and Pond Landscape biosphere reserve, which is characterized by a multitude of fish ponds, which are mostly surrounded by reeds and woodlands. These ponds are connected by a network of ditches with often natural-like bank structures. Further north, the Spree is part of a post-mining landscape and therefore regulated.
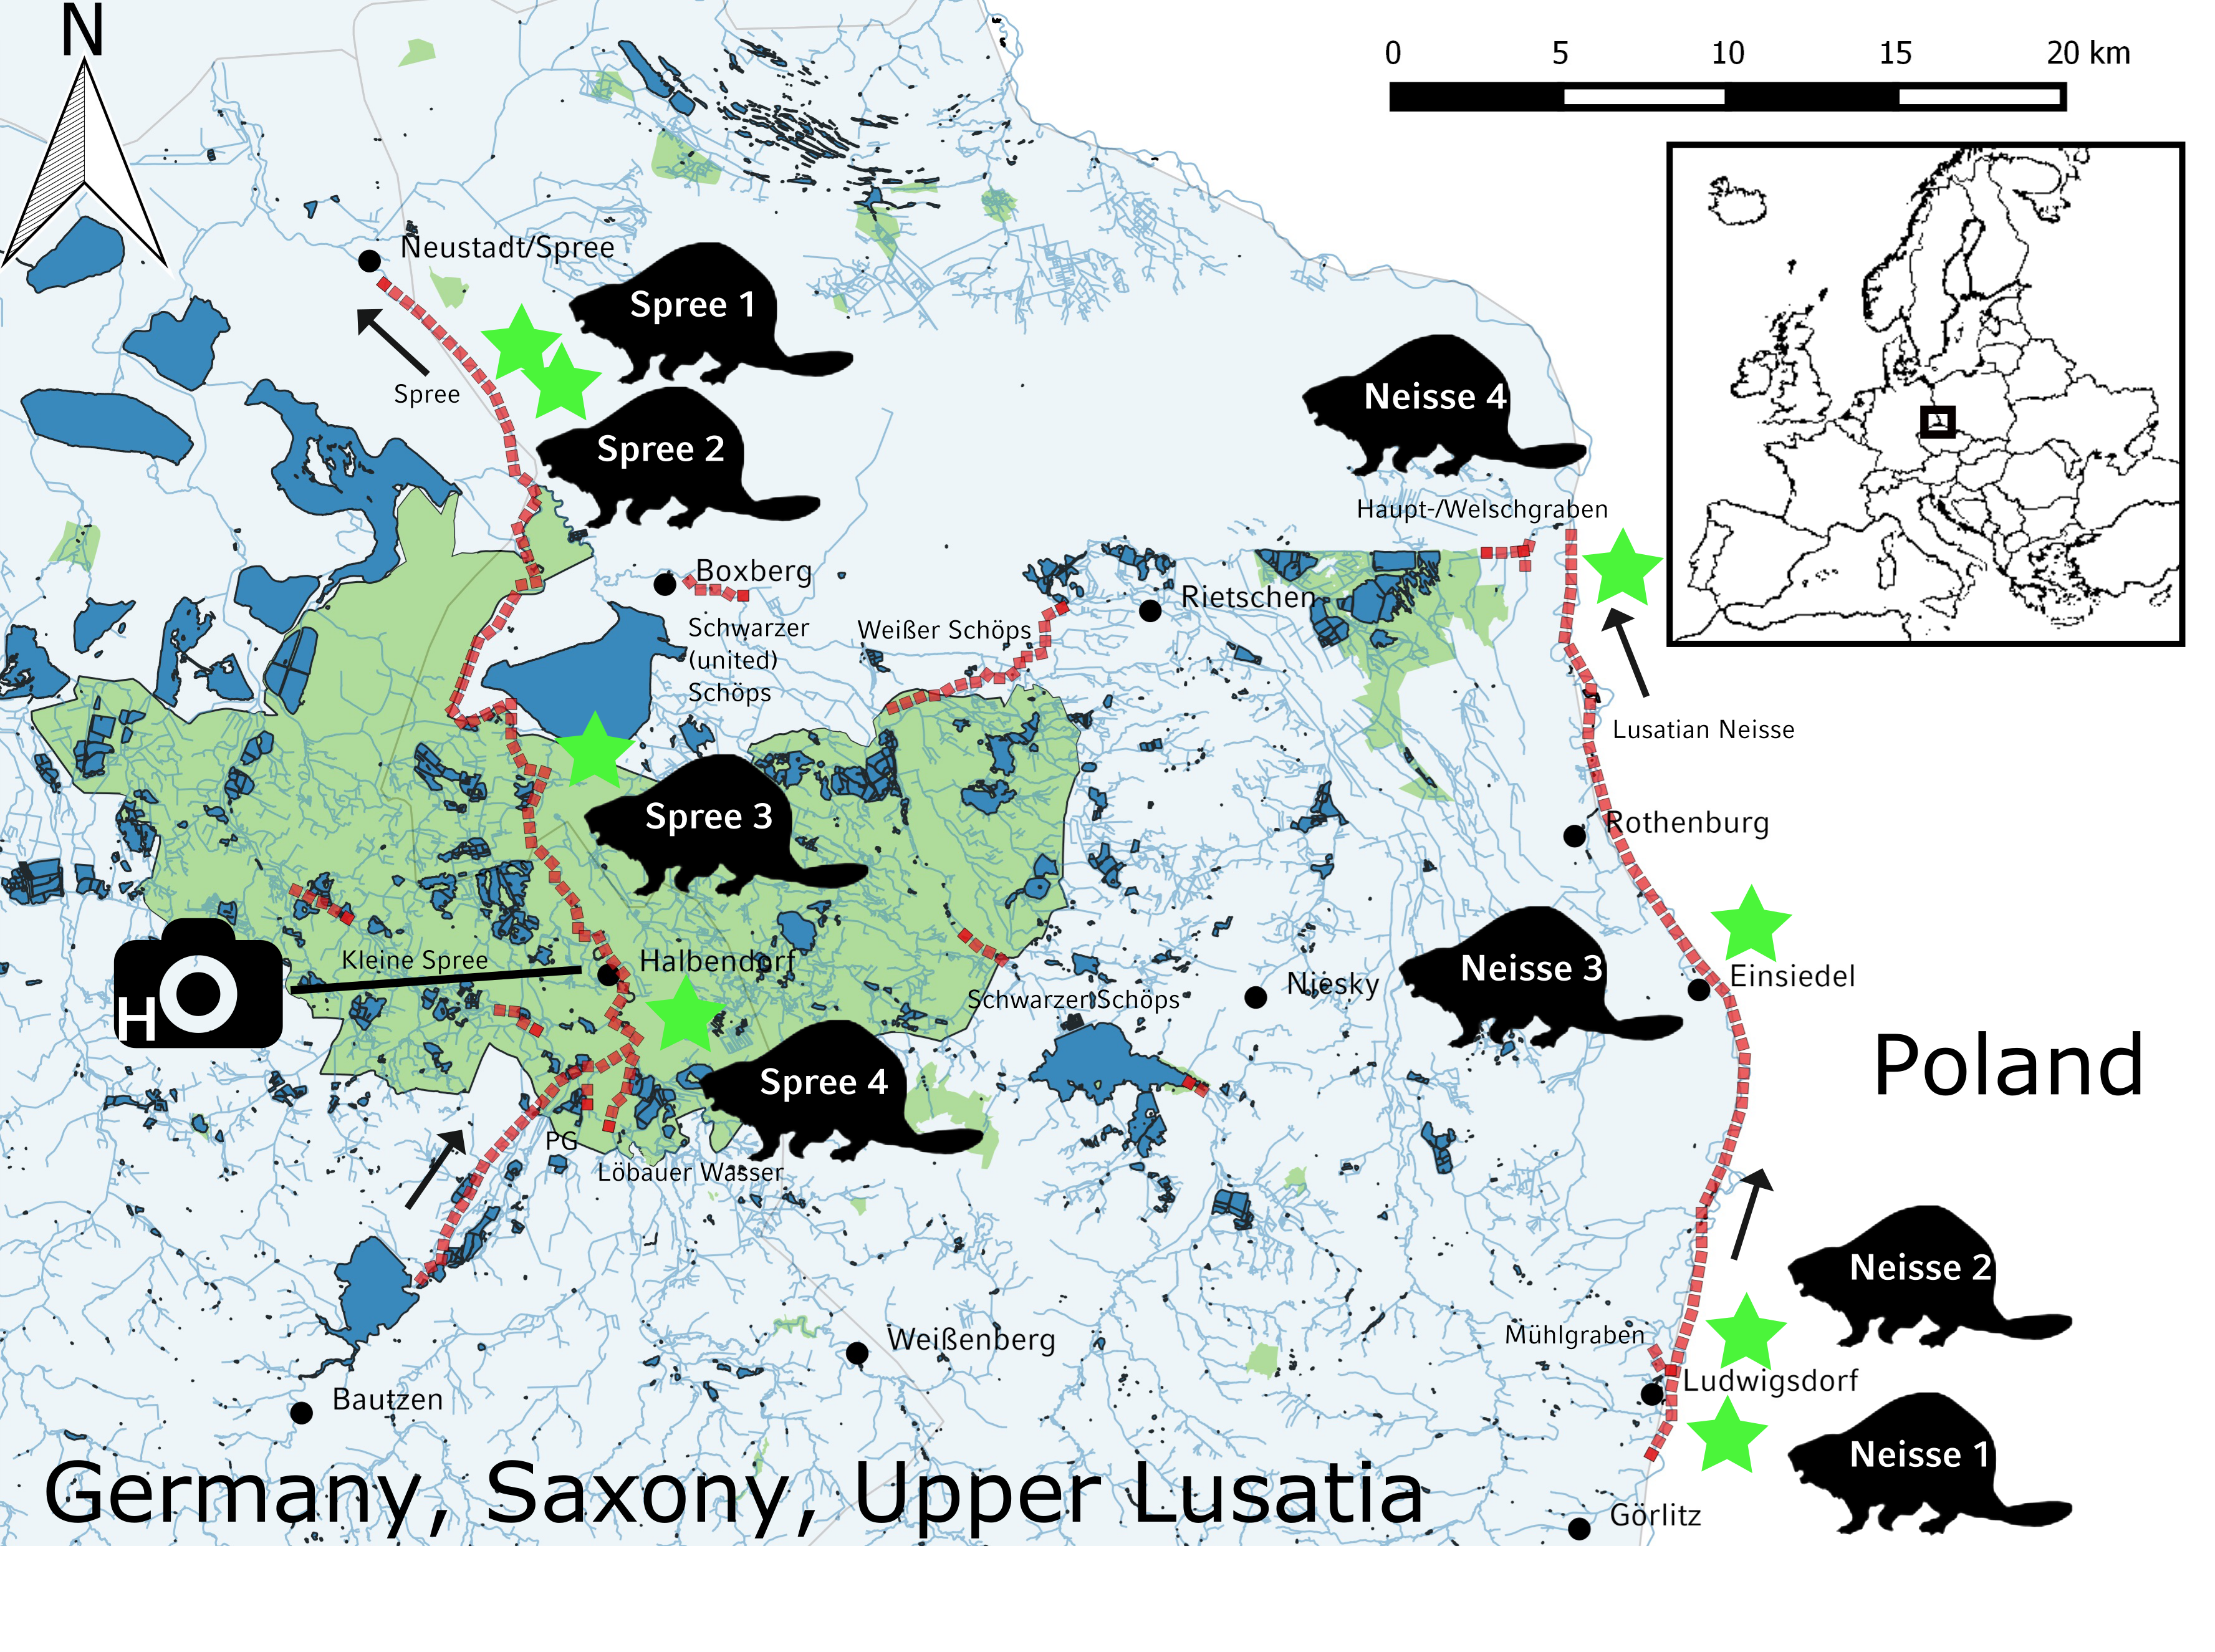
The floodplain of the Lusatian Neisse is characterized by meadows and only a small number of fish ponds in the surroundings. Further, two tributaries of the Spree, i.e., Schwarzer and Weißer Schöps, as well as few other small streams and channels of the catchment area of Spree and Lusatian Neisse were selectively investigated. The corresponding surroundings encompass several fish ponds with connecting channels between them. Due to mild winters, rivers of the study area are usually not completely covered by ice, and fish ponds do not regularly freeze up, but most of them are drained during wintertime. Feeding conditions for the otter are very good due to the high availability of fish in ponds and rivers (Füllner et al., 2016). Due to the lack of extensive riparian forests and natural riverbanks in the study area, food availability for the beaver in terms of herbs and softwood is limited.
Beaver and Otter Populations of the Study Area
Since their first reappearance in 1999 (Hertweck and Hieke, 1999), beavers have gradually colonized the Lusatian Neisse and eventually also the Spree (Pannach, 2011). Beavers of the Lusatian Neisse most likely originate from recolonization projects in Poland and are usually assigned to belong to the Castor fiber vistulanus Matschie (1907) subspecies (Hertweck and Hieke, 1999), which is also referred to as the hybridization result of the Castor fiber orientoeuropaeus Lavrov (1981) and Castor fiber belorussicus Lavrov (1981) subspecies (Durka et al., 2005).
Beavers of the Spree might originate from the eastern C. f. vistulanus population as well as from the autochthonous Castor fiber albicus Matschie (1907) population, which escaped the European extinction period during the 19th century as a relict population in the middle Elbe region (Durka et al., 2005). With regard to the otter, the population of the present study area is considered to be one of the most viable otter populations in Europe (Ansorge, 1994) and escaped extinction during the 20th century as a relict population in the study area.
METHODS
Survey Method and Period
The general survey method for both species was based on the standard procedure for the otter, such that the river was surveyed in 600 m sections along either riverside (Reuther et al., 2000). The specific method for the beaver survey was based on the works by Schwab and Schmidbauer (2001) and Heidecke (2005). Recorded beaver signs included beaver cuts, which were visually categorized into fresh and old cuts and three size ranges (1, 2-5, and > 5 trees or shrubs within a radius of 5 m) including the main tree or shrub species, beaver runs, footprints, dams, and lodges. Recorded otter presence signs included the number of spraints per sprainting site within a radius of 1 m, footprints, holts, and feeding sites. The Spree was sampled from October 2015 to January 2016 between the water reservoir Bautzen in the south (51.214° N, 14.471° E) and the village Neustadt/Spree in the north (51.480° N, 14.460° E), which corresponded to 48.6 km shoreline (Figure 1, left). The Lusatian Neisse was sampled from November 2015 to January 2016 between the villages Ludwigsdorf in the south (51.177° N, 15.005° E) and Steinbach in the north (51.420° N, 14.966 °E), which corresponded to 58.8 km shoreline (Figure 1, right). Further, two tributaries of the Spree, i.e., Schwarzer and Weißer Schöps, as well as few other small streams and channels of the catchment area of the Spree and the Lusatian Neisse were selectively sampled from January to April 2016, which corresponded to 24.6 km shoreline. During the above-mentioned survey periods, all river sections were sampled once in a consecutive manner. In addition, we investigated eight beaver territories and flanking sections at the Spree and the Lusatian Neisse, which had been identified before during the corresponding main survey periods (Figure 1, beaver pictograms). This additional survey took place between January and April 2016.
Activity Density Estimates
Current and former beaver activity densities were estimated as the sum of fresh and old tree cuts, respectively, weighted by their extent (1, 2-5, and > 5 trees or shrubs within a radius of 5 m), per investigated river section. In the case of the otter, the activity density estimate was calculated as the number of spraints collected per investigated river section (Almeida et al., 2013), which positively correlates with the actual number of otters and can hence be used as a semi-quantitative measure of population size and habitat usage (Guter et al., 2008; Almeida et al., 2013; Romanowski, 2013).
To get a closer view on the interspecific interaction, correlations between beaver and otter activity densities in distinct beaver territories (activity centres of home ranges, see Vorel et al. (2008)) and flanking river sections were investigated in an additional survey. Here, only fresh beaver tree cuts, together with beaver scats and deposited castoreum, were assessed along with otter presence signs. The primary outcome of this subanalysis was defined as the number of otter spraints per river section.
Camera Trapping
We assessed and compared activity patterns of beavers and otters as a function of daytime hour, month, and moon phase in our study area by the use of a camera trap. The camera (HC 600 HyperFire camera trap, Reconyx, Holmen, USA) was installed at a highly frequented land corridor between the Spree and one of its abandoned meanders in the Upper Lusatian Heath and Pond Landscape biosphere reserve (Figure 1). Data was collected between February 2015 and March 2017 with two gaps without data from 2016/08/04-2016/10/07 and 2016/11/10-2016/12/23 due to technical problems. The activity density estimates for both species were calculated as corridor traverses per daytime hour (0-23) and month (January-December). Activity patterns were obtained by visual inspection of the pictures without identification of individuals except for temporally close traverses.
Habitat Assessment
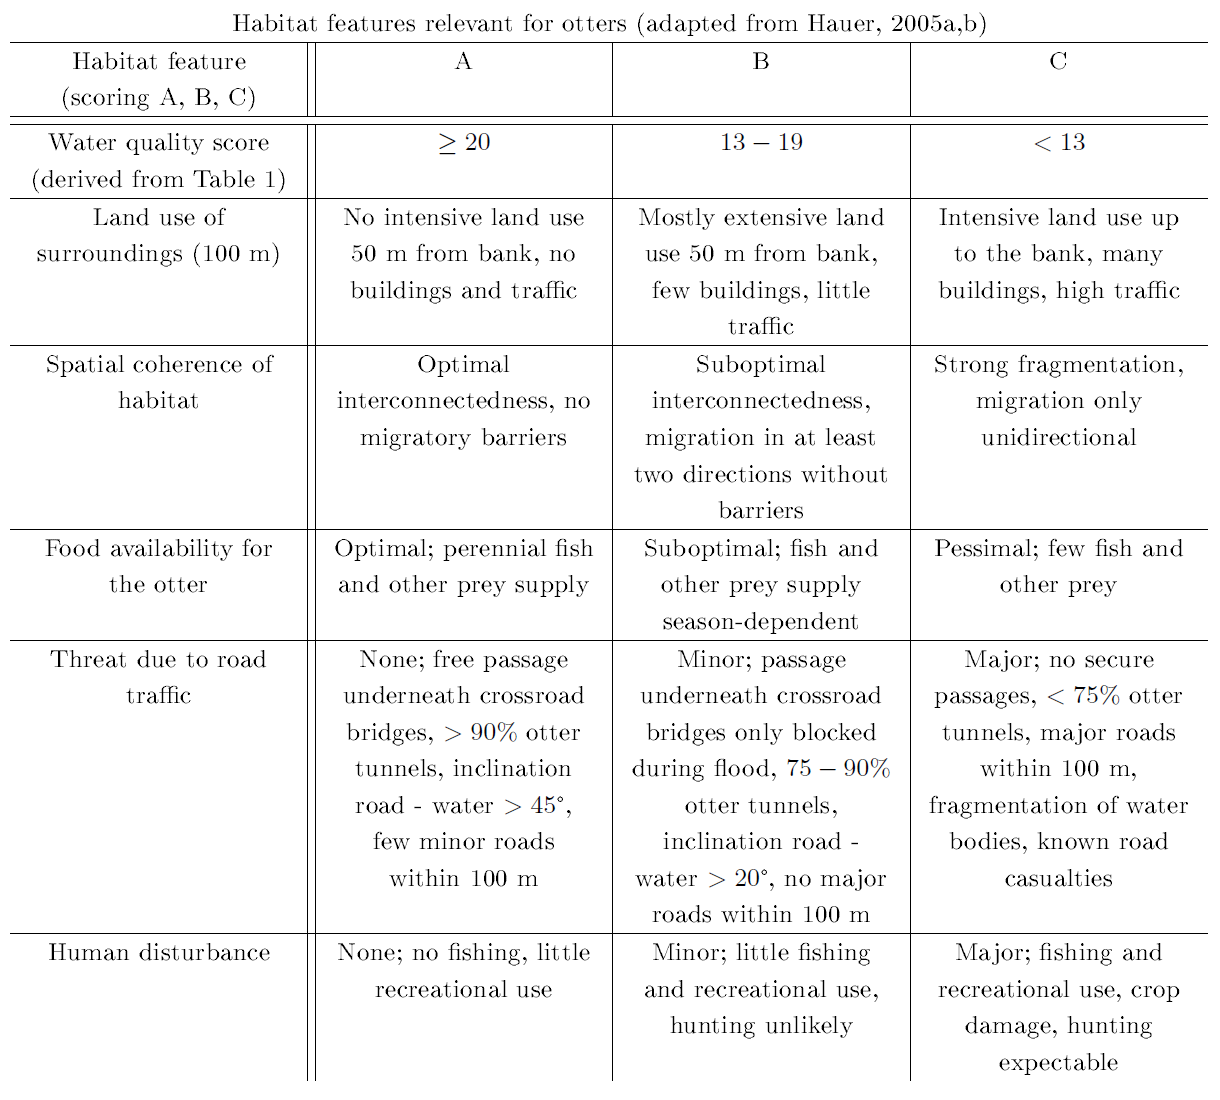
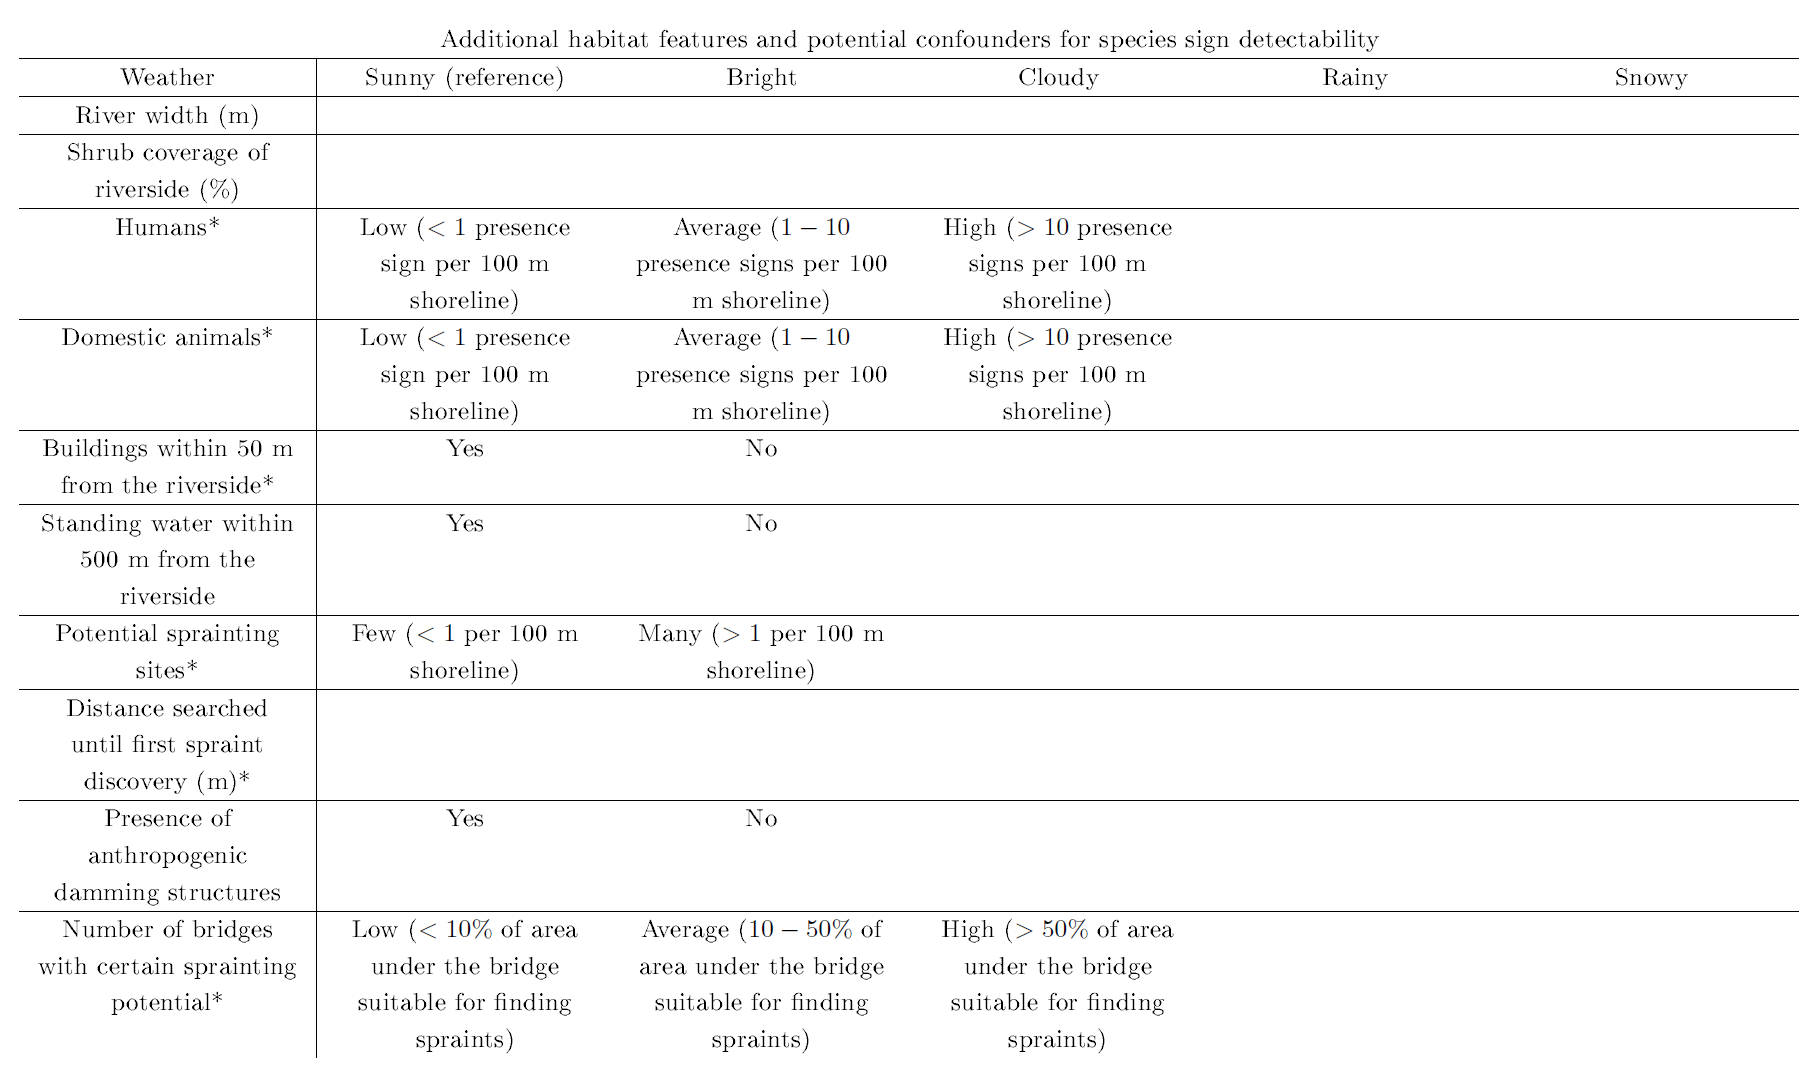
Assessment of habitat features was done for beavers and otters jointly using the otter habitat evaluation form by Peper and Peper (1996), which is given in Table 1. Further critical habitat features were adapted from the beaver and otter habitat evaluation forms by Hauer (2005a,b), which are given in Table 2. In addition, we recorded habitat features that may influence otter colonization success or are potential confounders for the detectability of otter presence signs (Romanowski, 2013; Romanowski et al., 2013), which can be found in Table 3.
| Table 1: Field survey Otter habitat evaluation form from Peper and Peper (1996) | |||||||
 |
|||||||
| Table 2: Habitat features relevant to otters as assessed during the field survey | |||||||
 |
|||||||
| Table 3: Additional habitat features and potential confounders for otter sign detectability as assessed during the field survey. * See also Romanowski (2013) | |||||||
 |
|||||||
Scores for all habitat features and potential confounders in Tables 1–3 were averaged over independent estimates of two researchers and were assessed in the field without further auxiliary data.
Statistical Analysis
Field Survey Data
The survey data was analysed separately for each river system (Spree, Lusatian Neisse, other streams) in an explorative manner using variable-by-variable testing to identify habitat features and potential confounders relevant to colonization success and sign discovery, respectively. In addition, presence signs of the beaver were also considered in the correlation analysis. The primary outcome, i.e., the activity density estimate for the otter was defined as the number of spraints per river section. Differences in activity density were assessed using non-parametric tests, because the otter activity density estimate is a non-normally distributed outcome. In the case of a two-sample problem, exact Mann-Whitney U tests were applied (Mann and Whitney, 1947). In the case of more than two groups without a specified order, the H test by Kruskal and Wallis (1952) was used, and when the group assignments corresponded to a specified order, the Jonckheere-Terpstra trend test was used instead (Jonckheere, 1954). P values for the H test and the Jonckheere-Terpstra trend test were simulated using 1,000,000 permutations under the null hypothesis of no difference in activity density between species. Correlations between activity density and continuous variables were tested using Spearman's correlation coefficient ρ. P values under the null hypothesis of no correlation were simulated using 100,000 replicates. In the case of the subanalysis in beaver territories, confidence intervals for the Spearman correlation coefficient were obtained using 10,000 bootstrap replicates (Efron and Tibshirani, 1993). Due to the explorative nature of the variable-by-variable analysis, P≤0.05 was considered significant, except for the separate subanalysis of beaver territories, which were corrected for multiple testing using the method by Benjamini and Hochberg (1995). All calculations were done using the statistical analysis software R (R Core Team, 2018). Calculation of H, Jonckheere-Terpstra trend, Mann-Whitney U, and Spearman correlation tests were done using the R package coin (Hothorn et al., 2006). Confidence intervals for the Spearman correlation coefficient were obtained using the R package RVAideMemoire (Hervé, 2016).
With regard to the regression model, the primary outcome was defined as the activity density estimate of the otter based on spraint counts per river section. Therefore, a generalized linear regression model for count data was used, which was selected on the basis of the Bayesian Information Criterion (BIC) (see e.g. McElduff et al. (2010) for the general selection procedure). Selection based on BIC was applied to a basic model including predefined fixed confounders, i.e., number of bridges, potential sprainting sites, presence of anthropogenic damming structures, river system (Spree, Lusatian Neisse, other streams), and weather, and using Poisson, zero-inflated Poisson, negative binomial, zero-inflated negative binomial, and hurdle models. Subsequently, all other explanatory, non-confounding variables in Table 4 were added to build up the full model. In addition, the weighted sum of fresh beaver cuts was also included in the full model to assess the impact of beaver activity on otter activity. Model selection on the non-confounding variables of the full model was based on the Akaike Information Criterion (AIC (Akaike, 1974)), except for the beaver activity as the variable of interest. Normality of residuals and goodness of model fit were investigated using a quantile-quantile plot of randomized quantile residuals and a rootogram (Kleiber and Zeileis, 2016), respectively. A rootogram visually compares the observed and fitted values of the activity densities. Multi-collinearity between variables was formally tested using the variance inflation factor (VIF) or, in the case of categorical variables, using the generalized VIF (GVIF (Fox and Monette, 1992)). The final number of predictors for the regression model was chosen, such that it still met the 10-observations-per-variable rule of thumb (Draper and Smith, 1998).
Regression analyses and model selection were carried out using the software package R (R Core Team, 2018). More specifically, the following additional R packages were used: countreg (Zeileis and Kleiber, 2018) for zero-inflated and hurdle models as well as regression diagnostic plots, MASS (Venables and Ripley, 2002) for the negative binomial regression, and glmulti (Calcagno, 2013) for the model selection based on AIC. P≤0.05 for regression coefficients was considered statistically significant.
Camera Trap Data
Analysis of activity patterns as determined by camera traps was done using the permutation test for temporal segregation as described in Niedballa et al. (2019). Specifically, the coefficient of overlap Δ̂1 (Ridout and Linkie, 2009) was calculated using the R package overlap (Meredith and Ridout, 2017) for the variables daytime (0-23 h) and month (1-12). The coefficient Δ̂1 ranges from 0 (complete temporal segregation) to 1. P values were simulated using 10,000 replicates under the null hypothesis of equality of the activity patterns of beavers and otters, i.e., Δ̂1, for both investigated outcomes. Differences in activity patterns with P≤0.05 were considered statistically significant.
Population Size Estimation of the beaver
Beaver population size was estimated by identifying the number of territories using the method by Schwab and Schmidbauer (2001), which assigns beaver territories on the basis of activity density centres measured by tree cuts. Accordingly, beaver territories are further divided into single/couple (1.5 beavers on average) or family (5 beavers on average) territories, thus allowing for the estimation of the number of individuals.
Population Size Estimation of the Otter
Sampling of Otter Spraints
Otter scats were sampled at 9 sprainting sites between January and February 2016 at the Spree and 10 sites between February and April 2016 at the Lusatian Neisse, such that the maximum distance between two consecutive sites did not exceed 15 km, which can be considered the lower bound of otter habitat requirements (Jenkins and Burrows, 1980; Green et al., 1984; Kruuk et al., 1993; Durbin, 1996; Durbin, 1998; Sulkava, 2006). Frequently used sprainting sites as identified during the previous field survey were selected for sampling, irrespective of the corresponding type of surroundings (e.g. natural or disturbed). Sprainting sites were cleaned prior to the first sampling day to provide optimal DNA quality, which is generally low for non-invasive otter scat samples (Hájková et al., 2006; Lampa et al., 2008). In addition, jelly spraints and spraints deposited on fresh-fallen snow were sampled as well without prior site cleaning. Spraints were collected in 40 ml 96 % ethanol, jelly spraints and occasionally mucous coats of spraints were sampled using sterile cotton swabs and stored in plastic bags with silica gel as drying agent.
DNA Extraction
Lysis and DNA extraction from otter jelly was done using the QIAamp-DNA-Investigator-Kit (Qiagen, Hilden, Germany). DNA from otter spraints was extracted using the QIAamp-DNA-Stool-Mini-Kit (Qiagen). All steps were performed according to the manufacturer's protocol in a dedicated laboratory for non-invasive samples. Purification and elution of DNA was performed by the automated extraction robot QIAcube (Qiagen). Extracted DNA was stored at 4 °C prior to further analysis.
mtDNA analysis
Species identification was done by amplification of the hypervariable mtDNA control region (Meyer et al., 1990) using the primer combinations L15995 (5'-CTCCACTATCAGCACCCAAAG-3') and H16498 (5'-CCTGAAGTAAGAACCAGATG-3') (Pun et al., 2009) for otter samples. More details about the amplification procedure can be found in Frosch et al. (2014). Sanger sequencing of the amplicons was performed on an ABI 3730 DNA Analyzer (Applied Biosystems, Waltham, USA) using primer L15995. Sequences were blasted against reference sequences of the NCBI Genbank (www.ncbi.nlm.nih.gov/genbank) using the BLAST utility function (Johnson et al., 2008). Sequences that were assigned to otters were aligned using the computer programs Bioedit (Hall, 1999) and Sequencher (Gene Codes Corporation, Ann Arbor, USA). The otter mtDNA haplotypes were classified according to the nomenclature in Mucci et al. (2010). It is of note that with the analyzed control region fragment, we were only able to distinguish the otter haplotypes 7/8 and 12 from the remaining 17 haplotypes described in Mucci et al. (2010), which, however, was sufficient to assign haplotypes to each sample of our study area.
Otter Microsatellite Analysis
Genotyping of otter DNA from spraints was done using 21 autosomal markers (Lut435, Lut453, Lut604, Lut615, Lut701, Lut715, Lut717, Lut733, Lut782, Lut818, Lut832, Lut833 (Dallas and Piertney, 1998); Lut902 (Dallas et al., 1999); OT04, OT05, OT07, OT14, OT17, OT19, OT22 (Huang et al., 2005); RI18 (Beheler et al., 2005)). According to the multiple-tubes approach (Taberlet et al., 1996), we performed all multiplex polymerase chain reactions (PCRs) in triplicates. Sex determination was performed using 3 gonosomal markers (SRY (Dallas et al., 2000); DBY7Ggu (Hedmark et al., 2004); ZFX/Y (Mucci and Randi, 2007)). PCRs were carried out in a final volume of 10 µl containing 5 µl HotstarTaq master mix, 1 µl primer mix, 0.8 µl RNA-free water, 0.2 µl BSA, and 3 µl sample DNA. Thermal cycling conditions were as follows: 15 min at 95 °C, 41 PCR cycles with 30 s at 95 °C, 90 s at 58 °C, and 60 s at 72 °C with a final time of 30 min at 72 °C. In addition, we genotyped 40 tissue reference probes (16 from our study area, 8 from Austria, 8 from Bavaria, and 8 from the Czech Republic, all taken from the reference tissue database of the Senckenberg Research Institute, Gelnhausen, Germany) in a single-tube approach to construct a genotype reference panel for the collected spraint samples. Fragment analysis of PCR products was performed at the Senckenberg Biodiversity and Climate Research Centre (BiK-F), Frankfurt, Germany, using an ABI 3730 DNA Analyzer (Applied Biosystems). Allele calling was done using the software GENEMARKER v2.2 (SoftGenetics, State College, USA). Consensus genotypes, allelic dropout and false alleles rates were calculated using GIMLET (Valière, 2002). Individualization of samples was based on the consensus genotypes taking the genotyping error rate and result of the sex determination into account. Specifically, two samples were assigned to two individuals, if each of them had at least 50 % successfully genotyped markers, i.e., for at least 11 loci, and their genotypes differed in at least 3 loci. Ambiguous samples were excluded from further analysis. The probability of identity for unrelated individuals (PID) and for siblings (PIDsib) (Waits et al., 2001) was calculated using GenAlEx 6.5 (Peakall and Smouse, 2006; Peakall and Smouse, 2012) to assess whether the number of investigated and successfully genotyped loci is sufficient to separate two unrelated individuals and siblings from each other, respectively. The number of individual genotypes was hence taken as an estimate for the population size at the Spree and the Lusatian Neisse. We furthermore extrapolated the otter population size estimate for both rivers together by applying the rarefaction method (Kohn et al., 1999) using non-linear regression in R (R Core Team, 2018).
RESULTS
Activity Density
At the Spree and the Lusatian Neisse, 12 and 18 beaver territories could be identified, respectively. Further, 50 % of the sections of the smaller streams, which were only selectively sampled, also showed beaver activity. As to the otter, 77 % and 66 % of the surveyed sections at the Spree and the Lusatian Neisse, respectively, and 76 % of the surveyed sections of the smaller streams were otter-positive. This resulted in an average number of 6.5 ± 8.7 (standard deviation, SD) spraints for the Spree, 6.1 ± 6.8 for the Lusatian Neisse, and 7.3 ± 7.8 for all other streams.
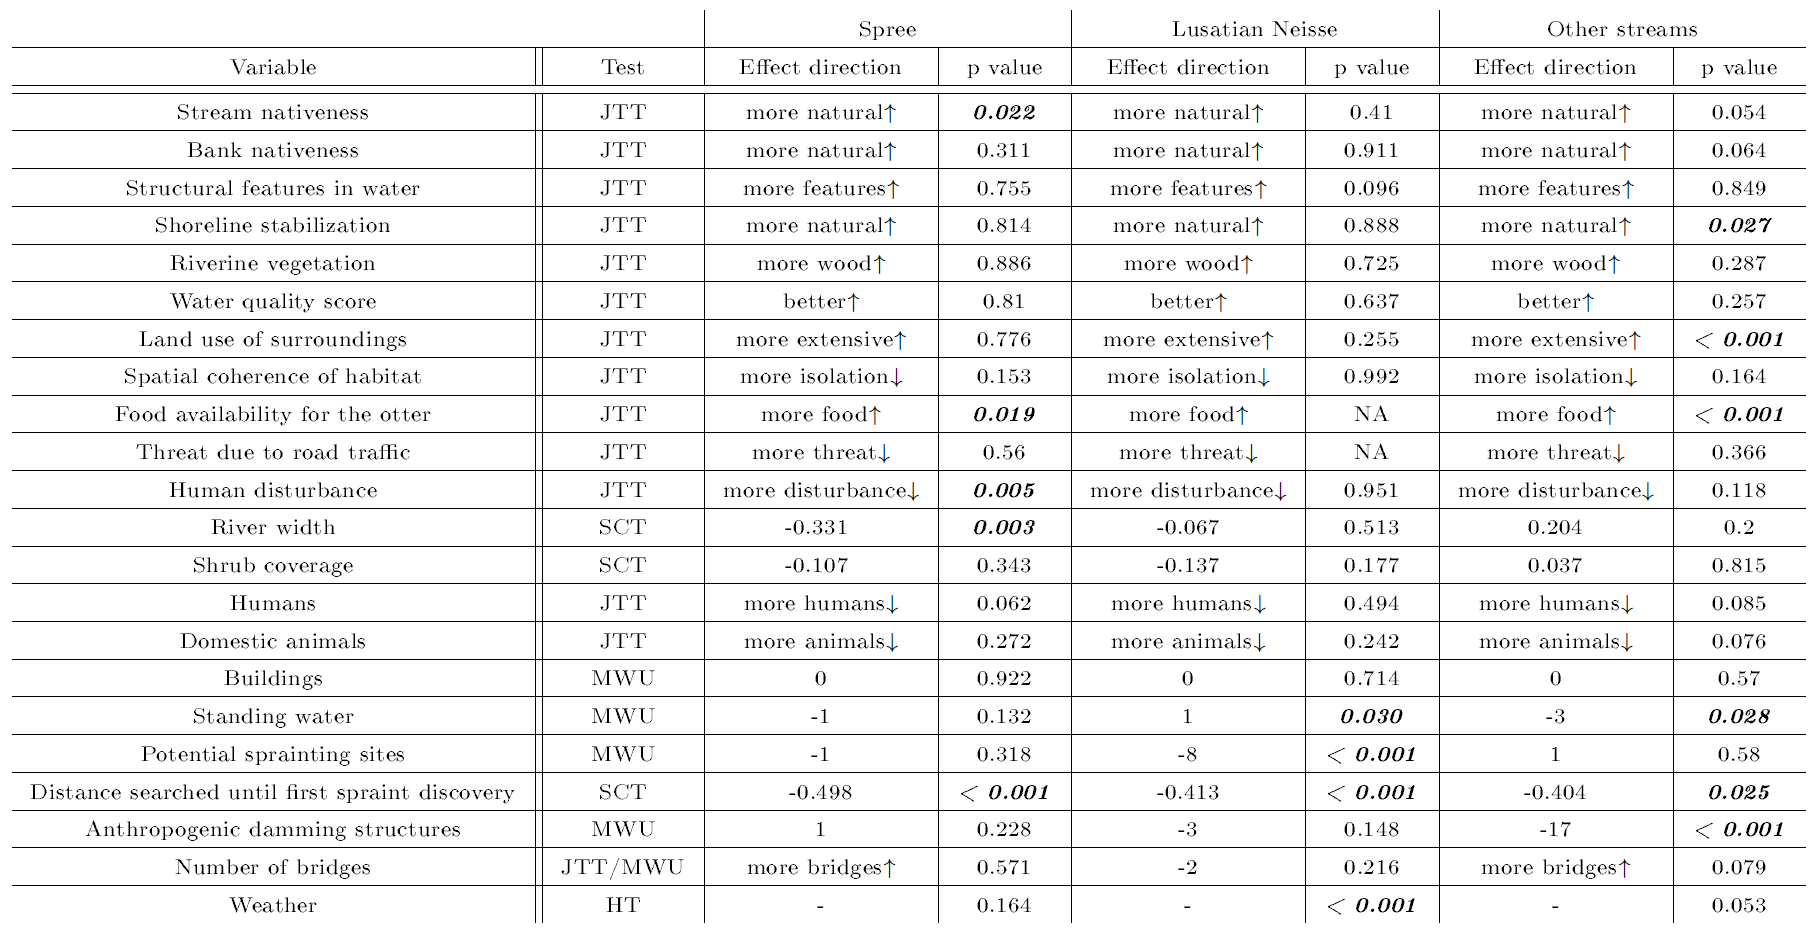
The results of the exploratory analysis to identify habitat features and potential confounders relevant to colonization success and sign discovery are summarized in Table 4.
The corresponding results of the correlation analysis of beaver presence signs with otter activity density can be found in Table 5. As a result, stream nativeness, shoreline stabilization, land use of surroundings, food availability for the otter, human disturbance, river width, standing water, potential sprainting sites, anthropogenic damming structures, and weather showed significant correlations with otter activity density for at least one river system (all P≤0.05, see Table 4). Moreover, the variable for the distance searched until first spraint discovery did not show a significant positive correlation with the habitat quality score (not shown), which would otherwise distort the ensuing analyses as explained in Romanowski et al. (1996) and Romanowski (2013). With regard to beaver signs, the most promising, albeit non-significant, results were obtained for weighted sums of fresh and old beaver tree cuts (Table 5).
| Table 5: Results of the exploratory correlation analysis of presence signs of the beaver with otter activity density. Results of the variable-by-variable tests are reported with values in bold and italics indicating significant findings with P≤0.05. For more details see Table 4. | |||||||
 |
|||||||
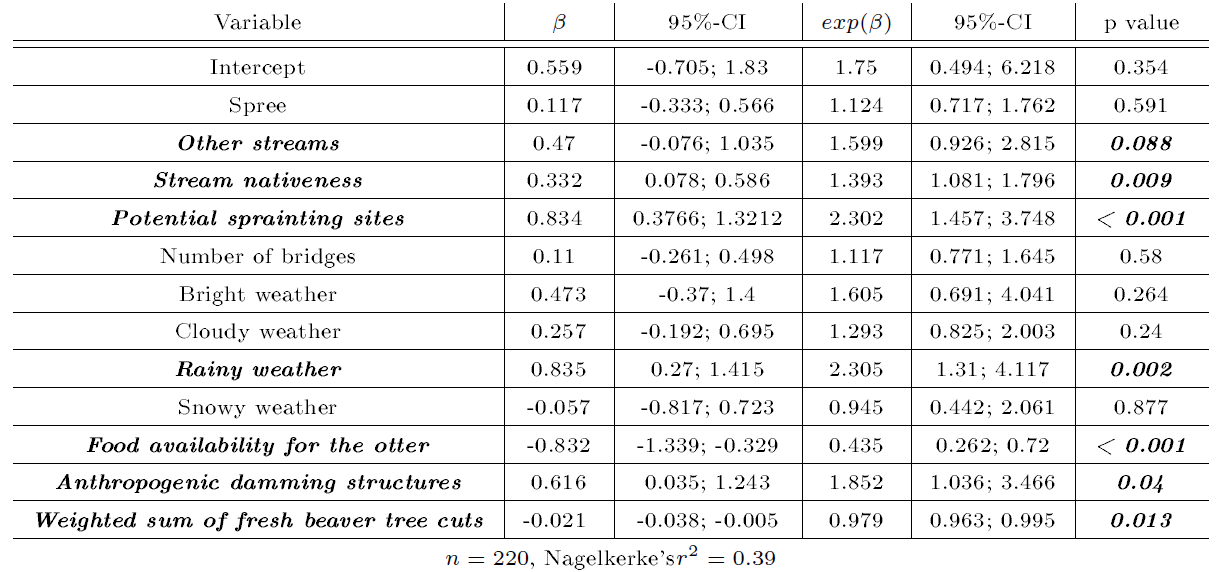
According to the regression model selection using the basic model and the BIC, a negative binomial regression model was found to optimally fit the data and was hence used for the final analysis. Accordingly, the best-fitting model according to the AIC included the predefined fixed confounders (number of bridges, potential sprainting sites, presence of anthropogenic damming structures, river system, and weather), the weighted sum of fresh beaver cuts, and the variables stream nativeness and food availability for the otter (Table 6).
| Table 6: Results of the negative binomial regression model with otter activity density as the primary outcome. β: regression coefficient; exp(β): transformed regression coefficient to the linear scale, corresponding to the incidence risk ratio (IRR); CI: confidence interval; n: sample size. The Lusatian Neisse was used as the reference category for the river system variable; sunny weather was used as the reference category for the weather variable. Nagelkerke's r²: goodness-of-fit measure (Nagelkerke, 1991). | |||||||
 |
|||||||
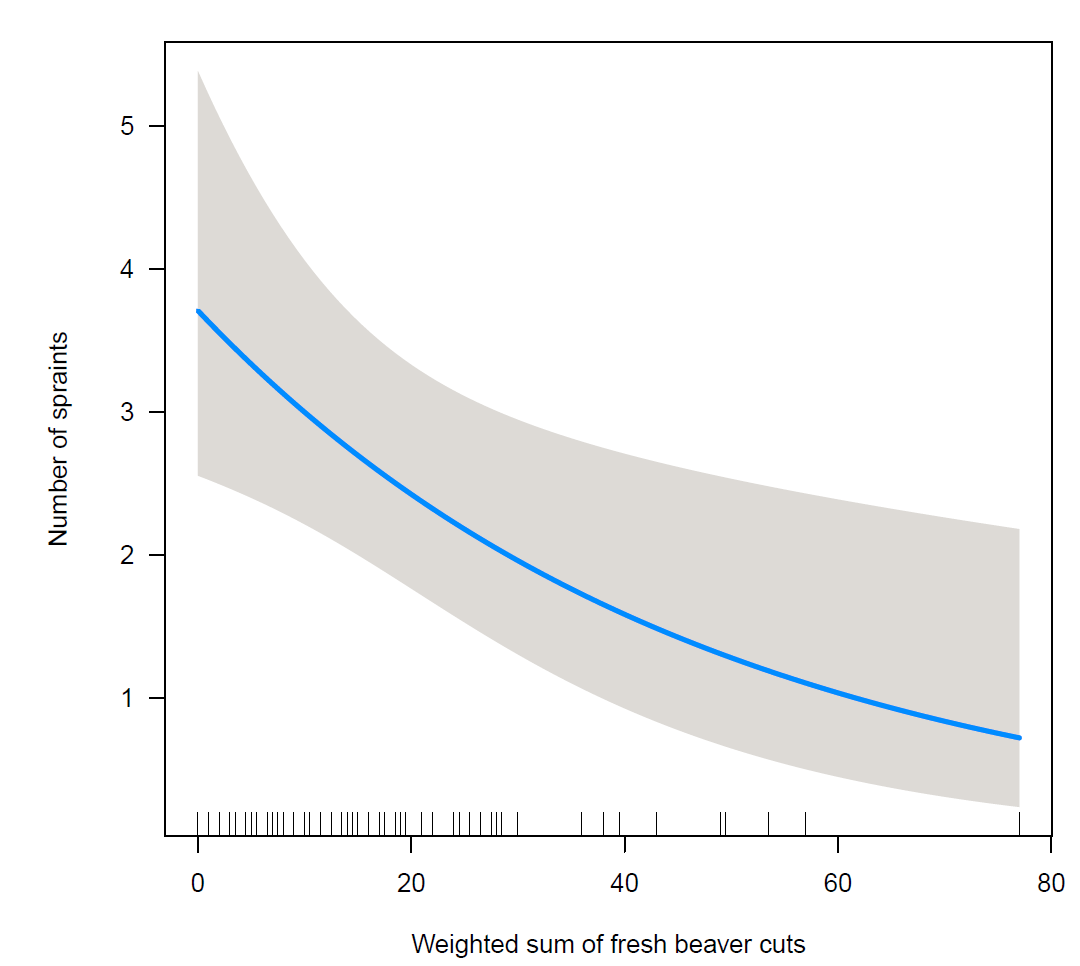
Among the potential confounders and habitat correlates, potential sprainting sites (P<0.001), anthropogenic damming structures (P=0.04), rainy weather (P=0.002), and stream nativeness (P=0.009) were significantly associated with otter activity density. The effect of beaver activity density on otter activity density according to the regression analysis is graphically displayed in Figure 2. As can be seen from Table 6, otter activity decreased by 2 % spraint for a unit increase in current beaver activity (P=0.013).
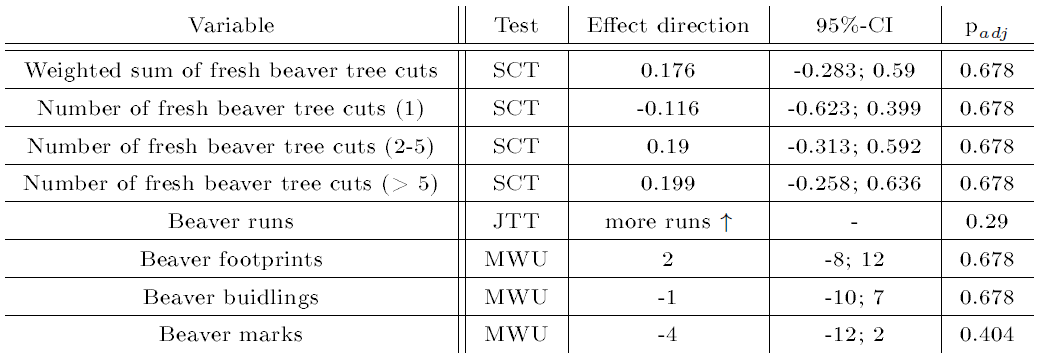
The correlation analysis in four beaver territories and flanking areas can be found in Table 7.Interestingly, larger beaver cuts were associated with more otter spraints, whereas beaver marks were correlated with fewer spraints. However, none of the findings were statistically significant.
| Table 7: Results of the explorative correlation analysis of otter spraints with presence signs of the beaver in beaver territories. padj : corrected p value using the procedure by Benjamini and Hochberg (1995). Numbers in brackets indicate the predefined size classes of beaver cuts. CI: confidence interval. For more details see Table 4. | |||||||
 |
|||||||
Activity patterns
In summary, 662 activities, i.e., land corridor traverses, of beavers and 266 activities of the otter were recorded. The corresponding distributions of activities as a function of daytime hour and month are shown in Figure 3.
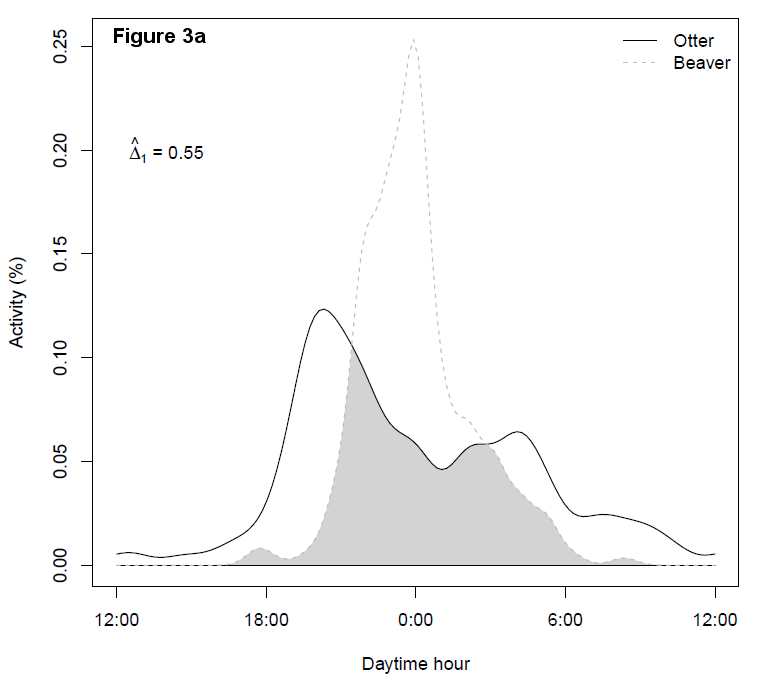
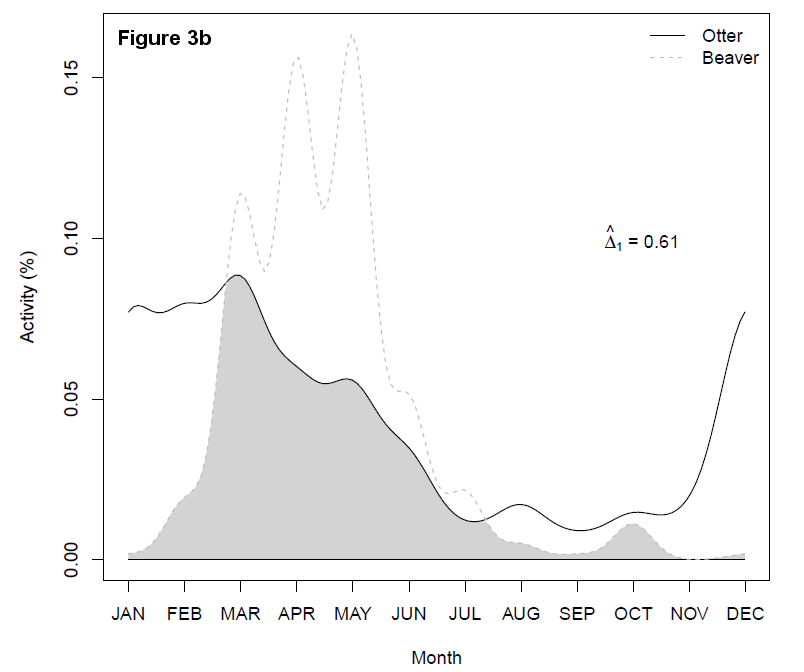
Beaver and otter activities were most numerous in spring between March and May, with an additional activity peak in December for the otter due to many traverses in 2015. With respect to daytime hour, beavers mostly traversed the corridor between 9 p.m. and 1 a.m., whereas otters were most frequently recorded between 7 p.m. and 10 p.m. and between 2 a.m. and 5 a.m. The differences in activity patterns subject to daytime hour and month were both significant (both P<0.0001), which might indicate temporal segregation of the two species ashore.
Species Identification
According to the analyzed mtDNA control region of the otter, all spraint samples (n=150) could be successfully assigned to L. lutra, all with mtDNA haplotype 7/8 according to Mucci et al. (2010), which was in line with previous findings for the study area (Mucci et al., 2010).
Population Sizes
Beaver
For the Spree, 20 activity centres with a median length of 450 m were recorded, corresponding to 12 beaver territories, including 5 family and 7 single/couple territories. For the Lusatian Neisse, 36 activity centres with a median length of 775 m were recorded, corresponding to 15 family and 3 single/couple territories. This corresponds to 0.9 and 1.4 individuals per km river section for the Spree and the Lusatian Neisse, respectively.
Otter
The genotyping results of the otter samples can be found in Table 8. Three samples were excluded from further analysis due to multiple triallelic loci during allele calling. From the remaining 147 samples, 93 samples could be assigned to a genotype of at least 11 autosomal loci.
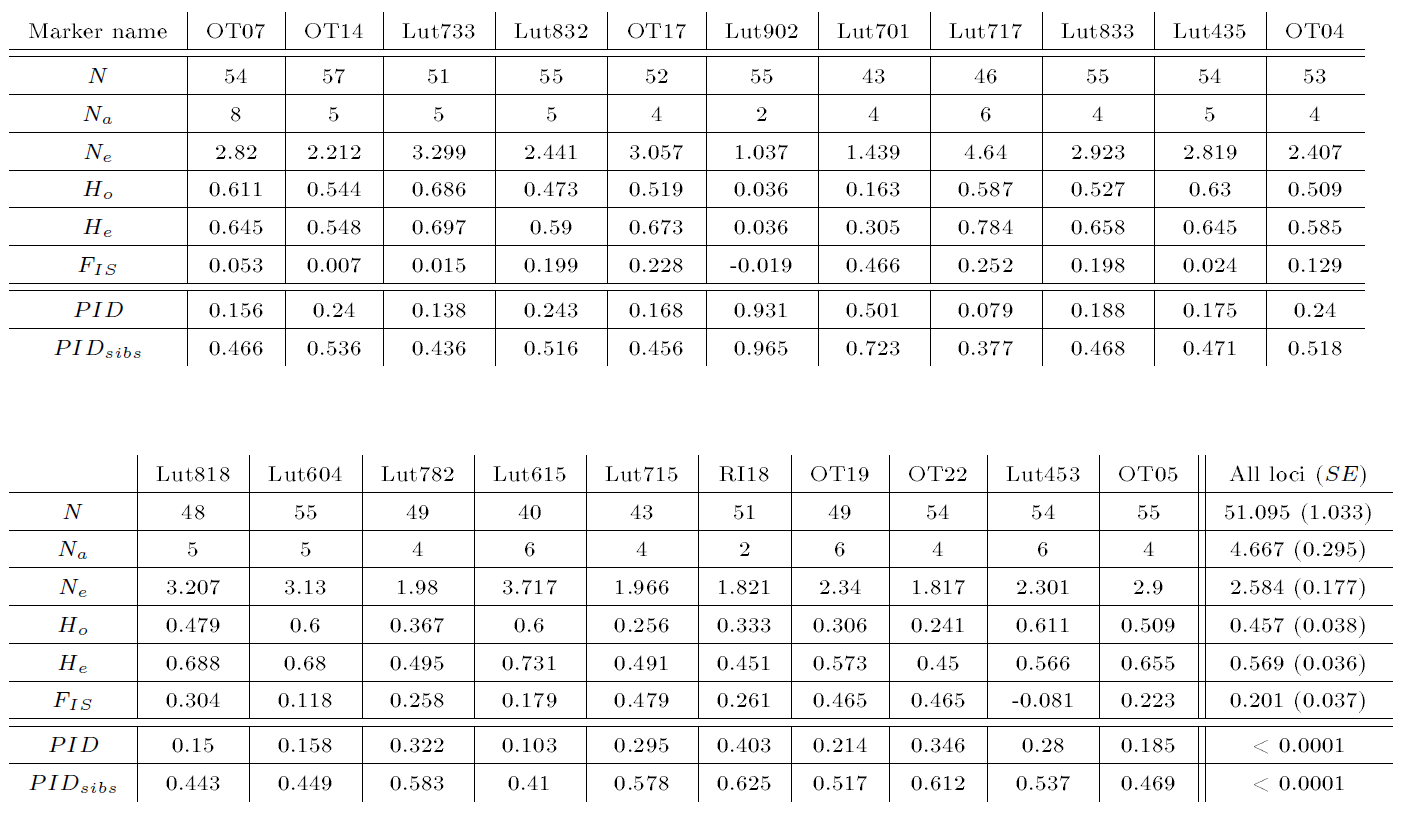
An overview of the genotyped markers and the corresponding PID and PIDsib are depicted in Table 9.
| Table 9: Overview of the autosomal microsatellite markers used for genotyping otter spraint samples, which resulted in 57 individuals. N: number of successfully genotyped individuals for a given marker; Na: number of alleles; Ne: effective number of alleles, i.e., 1/∑ipi², with pi the frequency of the i-th allele at a given locus; Ho: observerd heterozygosity, i.e., number of observed heterozygous genotypes / total number of observed genotypes; He: expected heterozygosity, i.e., 1-∑ipi², with pi the frequency of the i-th allele at a given locus; FIS: inbreeding coefficient calculated as 1-Ho/He; PID: probability of identity for genotypes of two unrelated individuals and PIDsibs: probability of identity for genotypes of siblings, both calculated according to Waits et al. (2001) | |||||||
 |
|||||||
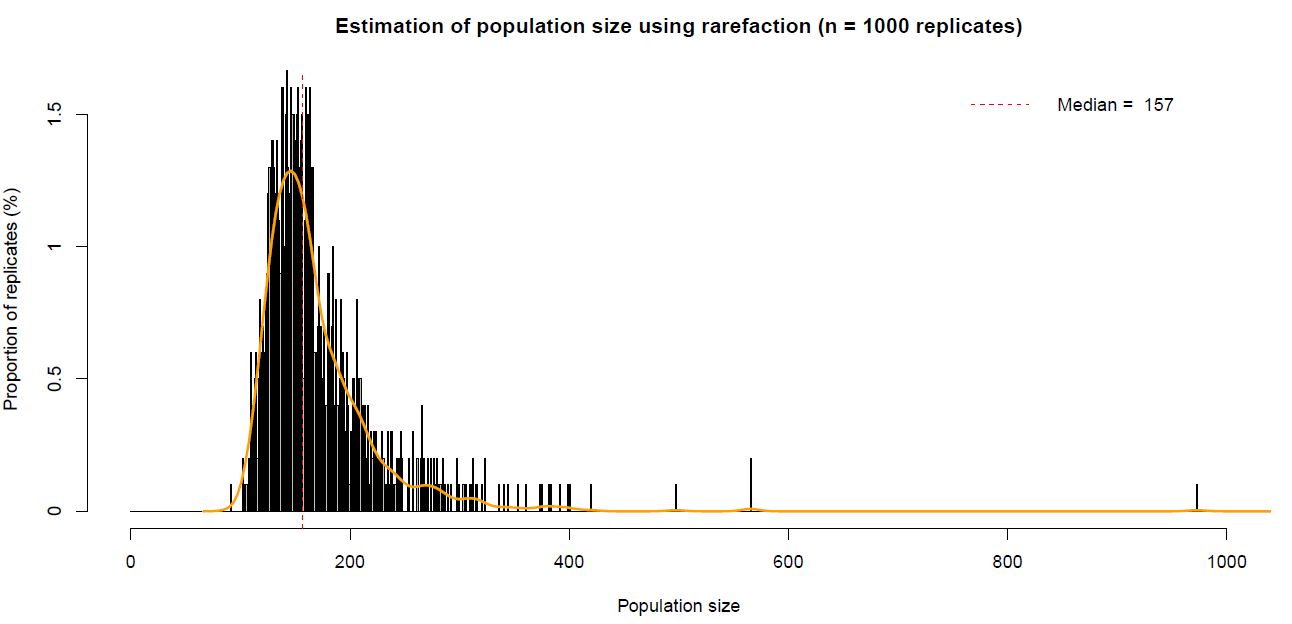
Accordingly, the probabilities for two unrelated individuals (PID) and siblings (PIDsib) having the same genotype, respectively, were lower than 0.0001 (see Table 9). The individualization resulted in 57 individuals with 26 (11 males, 14 females, 1 unknown gender) otters at the Spree and 31 (11 males, 15 females, 5 unknown gender) at the Lusatian Neisse. The corresponding otter densities hence were 0.54 otters/km and 0.53 otters/km at the Spree and the Lusatian Neisse, respectively. The extrapolated otter population density using the rarefaction method resulted in 157 otters (1.46 otters per km) for both rivers together (see Figure 4).
DISCUSSION
In this work, we tried to evaluate the interaction between Eurasian beavers and otters by comparing activity density estimates using correlation analysis and complex regression modelling, including potential confounders for habitat selection and species detectability. The beaver activity density estimate was calculated as a weighted sum of either fresh or old tree cuts per investigated river section. In the case of the otter, the activity density estimate was calculated as the number of spraints collected per investigated river section (Almeida et al., 2013). The suitability of counting otter spraints to estimate population sizes is under debate (Kruuk et al., 1986), but, in accordance with Almeida et al. (2013), we strongly believe that at least semi-quantitative measurements of otter activity are feasible.
In order to correctly model the effect of beaver activity on otter activity, potential confounders for otter habitat selection and detectability need to be identified. Critical habitat correlates for otter colonization in an anthropogenic environment are current matters of intensive debate (Romanowski et al., 2013). Evidence emerges that otters gradually colonize suboptimal habitats due to overpopulation in adjacent optimal primary habitats (Baltrūnaitė et al., 2009; Clavero et al., 2010; Romanowski et al., 2013). Critical factors favouring otter colonization of suboptimal anthropogenic habitats have only partly been identified and obviously strongly depend on the geographic region under study. Previous works suggest that otter abundance might be positively correlated with river width and depth in Poland (Romanowski et al., 2013). In addition, some works suggest a positive correlation between otter abundance and the availability of suitable holts and shrub coverage in Ireland (Ottino and Giller, 2004) as well as unregulated rivers in Poland (Romanowski et al., 2013). However, other works could not confirm a correlation between otter abundance and availability of holts in Poland (Romanowski, 2013), shrub coverage in Poland (Romanowski, 2013; Romanowski et al., 2013) and Great Britain (Kruuk et al., 1998), and unregulated rivers in Lithuania (Baltrūnaitė et al., 2009). A negative correlation between otter abundance and the presence of buildings was found in Lithuania (Baltrūnaitė et al., 2009) and South-East Poland (Brzeziński and Romanowski, 2006), but not in Central Poland (Romanowski et al., 2013). In addition, confounders influencing the probability to detect otter activity signs need to be identified and included in the regression analysis as well. Confounders for the detection probability of otter spraints might include the number of suitable sprainting sites (e.g. trees, stones, and sandbanks) (Romanowski et al., 2013), bridges (Romanowski, 2013), the presence of humans and domestic animals (Romanowski, 2013), and the presence of standing water nearby the riverside.
In the present study, we investigated a comprehensive set of potential confounders known from the literature, because most of their effects seem to be region-specific and hence have to be established anew for every other region (Romanowski et al., 2013). According to the results of our exploratory correlation analyses in Table 4, river width was negatively correlated with otter activity at the Spree (P=0.003), which was in line with Sidorovich et al. (1996), and might be due to the fact that otter abundance is linked to the relative fish biomass, which in turn is inversely proportional to river width (Schager and Peter, 2001). We also found human disturbance, i.e., mostly fishing and recreational use, to be negatively correlated with otter activity at the Spree (P=0.005). With regard to the regression analysis, only the variables stream nativeness and food availability were significantly and positively associated with higher otter activity density in addition to method-specific confounders, such as the availability of potential sprainting sites, presence of anthropogenic damming structures, smaller river systems, and rainy weather (see Table 6). The lack of other significant habitat features may be interpreted as a result of the otter's high adaptive potential that allows for the colonization of “suboptimal”, i.e., human-altered, habitats (Reid et al., 2013). Furthermore, rainy weather significantly increased the detectability of otter signs, probably due to the absence of low sun and hence better lighting conditions for finding spraints (P=0.002). In this context, it is of note that there was no substantial change of water levels during the study period, which could otherwise lead to washouts of spraints and consequently to reduced activity estimates. With respect to the impact of beaver activity, otter activity density decreased by 2 % per unit increase in fresh beaver cuts (P=0.013) (see Table 6). The correlation analysis of otter activity density as a function of beaver-related activity signs in beaver territories and flanking regions did not show any significant result, probably because of the small sample size (see Table 7). Hence, one may conclude that otter activity density is affected by a few habitat features and confounders and only slightly depends on beaver activity. Due to the little building activity of the beaver in our study area (only 3 minor dams), which seems to be more crucial when rivers are not sufficiently deep and wide (Harthun, 1999; Herr and Rosell, 2004), the presumed positive effect of beaver ponds for otters was absent. Beavers might also avoid otter activity centres to reduce the possibility of harmful encounters and hence increase protection of pubs from the otter as a potential agonist (Gallant and Sheldon, 2008).
As can be deduced from the results gained from the analysis of activity patterns using a camera trap, the possibility of direct encounters of beavers and otters ashore is reduced due to their different daytime hour preferences and the lowered activity density of the beaver during winter. However, due to the fact that we only had data for a single camera trap, this finding is of limited value and would need to be verified using a larger number of cameras and different land corridors.
A drawback of the field survey method applied in this study is that otter activity signs may have a reduced lifetime in beaver activity centres due to the high degree of beaver locomotion on runs, which are potential otter sprainting sites. This could lead to a reduced otter activity density estimate in beaver activity centres causing the observed inversely proportional relationship between beaver and otter activity. In addition, estimated activity densities of the present study were only based on surveys in autumn and winter, which, however, is the period showing the highest sprainting activity of otters in other studies (Conroy and French, 1987; Macdonald and Mason, 1987; Kruuk, 1992). In contrast, quantitative collection of otter spraints during the growing season is unfeasible. Further, more longitudinal data and camera traps are needed to validate and generalize the findings of the present study.
Despite the above-mentioned limitations, the study region was well-suited for such a quantitative correlation analysis, which was underpinned by population size estimates for the Spree and the Lusatian Neisse for both beavers and otters. The estimated density of 0.9 and 1.4 beavers per river km for the Spree and the Lusatian Neisse, respectively, corresponded well to the numbers given in Djoshkin and Safonow (1972) for suboptimal habitats (0.7-2.4). The estimated otter population size based on DNA fingerprinting and rarefaction of 1.46 otters per river km was comparatively high (see Lampa et al. (2015)), but still plausible in regard to the outstanding significance of the otter population in our study area (Ansorge, 1994). Furthermore, the study period shows the lowest otter birth rate in the study area, thus ruling out additional underrepresentation of female scats in the sample (Hauer et al., 2002; Lampa et al., 2015), and it is the time when otters increasingly appear at streams due to drained fishery ponds in winter (Lampa et al., 2015). The otter population size presented in this work, however, should be interpreted as a rough estimate, because DNA fingerprinting methods for otters are extremely error-prone and demand even more samples and replications than we were able to perform to validate the results (Lampa et al., 2015).
In summary, the results of the field survey data indicated that otter activity was only slightly influenced by beaver activity. This might be due to the fact that the study area, with a long history of pond fisheries, already provides optimal otter hunting grounds. In turn, beavers did not show a pronounced building activity, probably because the rivers Spree and Lusatian Neisse are sufficiently deep and wide to facilitate colonization. We were able to demonstrate that beavers and otters mainly traverse a land corridor at different daytime hours during the night. In contrast to beavers, otter activity ashore was high during winter. This was probably due to a spatial reorganization of pond and river home ranges with an increasing number of otters foraging in river habitats due to winter draining of fish ponds. According to our population size estimates, the study area is densely populated by otters, whereas the beaver population size indicated suboptimal habitat conditions.
REFERENCES
Akaike, H. (1974), A new look at the statistical model identification. IEEE Transactions on Automatic Control, 19 (6): 716–723, doi:10.1109/TAC.1974.1100705
Almeida, D., Rodolfo, N., Sayer, C. D., Copp, G. H. (2013). Seasonal use of ponds as foraging habitat by Eurasian otter with description of an alternative handling technique for common toad predation. Folia Zoologica 62: 214–221.
Ansorge, H. (1994). Zur Situation des eurasischen Fischotters Lutra lutra Linné, 1758 im Raum Oberlausitz-Sachsen. Säugetierkundliche Informationen 3: 617–622.
Baltrūnaitė, L., Balčiauskas, L., Matulaitis, R., Stirkė, V. (2009). Otter distribution in Lithuania in 2008 and changes in the last decade. Estonian Journal of Ecology 58: 94–102.
Beheler, A. S., Fike, J. A., Dharmarajan, G., Rhodes, O. E., Serfass, T. L. (2005). Ten new polymorphic microsatellite loci for North American river otters (Lontra canadensis) and their utility in related mustelids. Molecular Ecology Notes 5: 602–604.
Benjamini, Y., Hochberg, Y. (1995). Controlling the false discovery rate: a practical and powerful approach to multiple testing. Journal of the Royal Statistical Society, Series B (Methodological) 57: 289–300.
Breheny, P., Burchett, W. (2017). Visualization of regression models using visreg. The R Journal 9: 56–71.
Bruford, M. W., Wayne, R. K. (1993). Microsatellites and their application to population genetic studies. Current Opinion in Genetics and Development 3: 939–943.
Brzeziński, M., Romanowski, J. (2006). Experiments on sprainting activity of otters (Lutra lutra) in Bieszczady Mountains, south-eastern Poland. Mammalia 70: 58–63.
Calcagno, V. (2013). glmulti: Model selection and multimodel inference made easy. R package version 1.0.7.
Campbell-Palmer, R., Rosell, F. (2015). Captive care and welfare considerations for beavers. Zoo Biology 34: 101–109.
Clavero, M., Hermoso, V., Brotons, L., Delibes, M. (2010). Natural, human and spatial constraints to expanding populations of otters in the Iberian Peninsula. Journal of Biogeography 37: 2345–2357.
Collen, P., Gibson, R. J. (2000). The general ecology of beavers (Castor spp.), as related to their influence on stream ecosystems and riparian habitats, and the subsequent effects on fish – a review. Reviews in Fish Biology and Fisheries 10: 439–461.
Conroy, J. W. H., French, D. D. (1987). The use of spraints to monitor populations of otters (Lutra lutra L.). Symposia of the Zoological Society of London 58: 247–262.
Dallas, J. F., Bacon, P. J., Carss, D. N., Conroy, J. W. H., Green, R., Jefferies, D. J., Kruuk, H., Marshall, F., Piertney, S. B., Racey, P. A. (1999). Genetic diversity in the Eurasian otter, Lutra lutra, in Scotland. Evidence from microsatellite polymorphism. Biological Journal of the Linnean Society 68: 73–86.
Dallas, J. F., Carss, D. N., Marshall, F., Koepfli, K.-P., Kruuk, H., Piertney, S. B., Bacon, P. J. (2000). Sex identification of the Eurasian otter Lutra lutra by PCR typing spraints. Conservation Genetics 1: 181–183.
Dallas, J. F., Piertney, S. B. (1998). Microsatellite primers for the Eurasian otter. Molecular Ecology 7: 1248–1251.
Djoshkin, W. W., Safonow, W. G. (1972). Die Biber der Alten und Neuen Welt. A. Ziemsen Verlag, Lutherstadt Wittenberg .
Draper, N. R., Smith, H. (1998). Applied Regression Analysis, 3rd Edition. Wiley, New York.
Durbin, L. S. (1996). Individual differences in spatial utilization of a river-system by otters Lutra lutra. Acta Theriologica 41: 137–147.
Durbin, L. S. (1998). Habitat selection by five otters Lutra lutra in rivers of northern Scotland. Journal of Zoology 245: 85–92.
Durka, W., Babik, W., Ducroz, J.-F., Heidecke, D., Rosell, F., Samjaa, R., Saveljev, A. P., Stubbe, A., Ulevičius, A., Stubbe, M. (2005). Mitochondrial phylogeography of the Eurasian beaver Castor fiber L. Molecular Ecology 14: 3843–3856
Efron, B., Tibshirani, R. J. (1993). An Introduction to the Bootstrap. CRC Press, Boca Raton.
Frosch, C., Kraus, R. H. S., Angst, C., Allgöwer, R., Michaux, J., Teubner, J., Nowak, C. (2014). The genetic legacy of multiple beaver reintroductions in Central Europe. PLoS One 9: e97619.
Füllner, G., Pfeifer, M., Völker, F., Zarske, A. (2016). Atlas der Fische Sachsens. Sächsisches Landesamt für Umwelt, Landwirtschaft und Geologie, Dresden.
Fox, J., Monette, G. (1992). Generalized collinearity diagnostics. Journal of the American Statistical Association 87: 178–183.
Gallant, D., Sheldon, A. (2008). Agonistic interactions between river otters and beavers: an observation and review. IUCN Otter Specialist Group Bulletin 25: 23–27.
Green, H. U. (1932). Observations on the occurrence of otter in the Riding Mountain National Park, Manitoba, in relation to beaver life. Canadian Field-Naturalist 46: 204–206.
Green, J., Green, R., Jefferies, D. J. (1984). A radio-tracking survey of otters Lutra lutra on a Perthshire river system. Lutra 27: 85–145.
Guter, A., Dolev, A., Saltz, D, Kronfeld-Schor, N. (2008). Using videotaping to validate the use of spraints as an index of Eurasian otter (Lutra lutra) activity. Ecological Indicators 8: 462–465.
Hájková, P., Zemanová, B., Bryja, J., Hájek, B., Roche, K., Tkadlec, E., Zima, J. (2006). Factors affecting success of PCR amplification of microsatellite loci from otter faeces. Molecular Ecology Notes 6: 559–562.
Hall, T. A. (1999). BioEdit: a user-friendly biological sequence alignment editor and analysis program for Windows 95/98/NT. Nucleic Acid Symposium Series 41: 95–98.
Halley, D. J. (2011). Sourcing Eurasian beaver Castor fiber stock for reintroductions in Great Britain and Western Europe. Mammal Review 41: 40–53.
Harthun, M. (1999). Der Einfluß des Bibers (Castor fiber albicus) auf die Fauna (Odonata, Mollusca, Trichoptera, Ephemeroptera, Diptera) von Mittelgebirgsbächen in Hessen (Deutschland). Limnologica – Ecology and Management of Inland Waters 29: 449–464.
Hauer, S. (2005a). Kartier- und Bewertungsschlüssel von FFH-Anhang II-Arten in SCI: 1355 Fischotter (Lutra lutra).
https://www.umwelt.sachsen.de/umwelt/download/KBS_Fischotter_Mai_2005.doc.pdf
Retrieved 2019/10/29.
Hauer, S. (2005b). Kartier- und Bewertungsschlüssel von FFH-Anhang II-Arten in SCI: 1337 Biber (Castor fiber).
https://www.umwelt.sachsen.de/umwelt/download/KBS_Biber_Mai_2005.doc.pdf
Retrieved 2019/10/29
Hauer, S., Ansorge, H., Zinke, O. (2002). Reproductive performance of otters Lutra lutra (Linnaeus, 1758) in Eastern Germany: low reproduction in a long-term strategy. Biological Journal of the Linnean Society 77: 329–340.
Hedmark, E., Flagstad, Ø., Segerström, P., Persson, J., Landa, A., Ellegren, H. (2004). DNA-based individual and sex identification from wolverine (Gulo Gulo) faeces and urine. Conservation Genetics 5: 405–410.
Heidecke, D. (2005). Anleitung zur Biberbestandserfassung und -kartierung. Arbeitskreis Biberschutz im NABU Landesverband Sachsen-Anhalt: Mitteilungen des Arbeitskreises Biberschutz 1.
Herr, J., Rosell, F. (2004). Use of space and movement patterns in monogamous adult Eurasian beavers (Castor fiber). Journal of Zoology 262: 257–264.
Hertweck, K., Hieke, A. (1999). Erster Nachweis des Bibers (Castor fiber) an der Oberlausitzer Neiße seit über 200 Jahren. Veröffentlichungen des Museums der Westlausitz Kamenz 21: 87–90.
Hervé, M. (2016). RVAideMemoire: Diverse basic statistical and graphical functions. R package version 0.9-56.
Hothorn, T., Hornik, K., van de Wiel, M. A., Zeileis, A. (2006). A lego system for conditional inference. The American Statistician 60: 257–263.
Huang, C.-C., Hsu, Y.-C., Lee, L.-L., Li, S.-H. (2005). Isolation and characterization of tetramicrosatellite DNA markers in the Eurasian otter (Lutra lutra). Molecular Ecology Notes 5: 314–316
Jenkins, D., Burrows, D. (1980). Ecology of otters in northern Scotland. III. The use of faeces as indicators of otter (Lutra lutra) density and distribution. Journal of Animal Ecology 49: 755–774.
Johnson, M., Zaretskaya, I., Raytselis, Y., Merezhuk, Y., McGinnis, S., Madden, T. L. (2008). NCBI BLAST: a better web interface. Nucleic Acid Research 36: W5–W9.
Jonckheere, A. R. (1954). A distribution-free k-sample test against ordered alternatives. Biometrika 41: 133–145.
Karamanlidis, A. A., Hornigold, K., Krambokoukis, L., Papakostas, G., Stefanidis, K., Quaglietta, L. (2014). Occurrence, food habits, and activity patterns of Eurasian otters Lutra lutra in northwestern Greece: implications for research and conservation. Mammalia 78: 239–243.
Kleiber, C., Zeileis, A. (2016). Visualizing count data regressions using rootograms. The American Statistician 70: 296–303.
Klenke, R., Ring, I., Schwerdtner Máñez, K., Habighorst, R., Weiss, V., Wittmer, H., Gruber, B., Lampa, S., Henle, K. (2013). Otters in Saxony: A Story of Successful Conflict Resolution. In: R. Klenke et al. eds. Human – Wildlife Conflicts in Europe: Fisheries and Fish-eating Vertebrates as a Model Case, pp. 107–140. Springer, Berlin, Heidelberg.
Kohn, M. H., Wayne, R. K. (1997). Facts from feces revisited. Trends in Ecology & Evolution 12: 223–227.
Kohn, M. H., York, E. C., Kamradt, D. A., Haught, G., Sauvajot, R. M., Wayne, R. K. (1999). Estimating population size by genotyping faeces. Proceedings of the Royal Society B: Biological Sciences 266: 657–663.
Kruskal, W. H., Wallis, W. A. (1952). Use of ranks in one-criterion variance analysis. Journal of the American Statistical Association 47: 583–621.
Kruuk, H. (1992). Scent marking by otters (Lutra lutra): signaling the use of resources. Behavioral Ecology 3: 133–140.
Kruuk, H., Carss, D. N., Conroy, J. W. H., Durbin, L. (1993). Otter (Lutra lutra L.) numbers and fish productivity in rivers in N.E. Scotland. Symposia proceedings of the Zoological Society London 65: 171–191.
Kruuk, H., Carss, D. N., Conroy, J. W. H., Gaywood, M. J. (1998). Habitat use and conservation of otters (Lutra lutra) in Britain: a review. Symposia of the Zoological Society of London 71: 119–133.
Kruuk, H., Conroy, J. W. H., Glimmerveen, U., Ouwerkerk, E. J. (1986). The use of spraints to survey populations of otters (Lutra lutra). Biological Conservation 35: 187–194.
Lampa, S., Gruber, B., Henle, K., Hoehn, M. (2008). An optimisation approach to increase DNA amplification success of otter faeces. Conservation Genetics 9: 201.
Lampa, S., Mihoub, J.-B., Gruber, B., Klenke, R., Henle, K. (2015). Non-invasive genetic mark-recapture as a means to study population sizes and marking behaviour of the elusive Eurasian otter (Lutra lutra). PLOS ONE 10: e0125684.
Macdonald, S. M., Mason, C. F. (1987). Seasonal marking in an otter population. Acta Theriologica 32: 449–462.
Mann, H. B., Whitney, D. R. (1947). On a test of whether one of two random variables is stochastically larger than the other. The Annals of Mathematical Statistics 18: 50–60.
Mason, C. F., Macdonald, S. M. (1986). Otters: Ecology and Conservation. Cambridge University Press, New York.
McElduff, F., Cortina-Borja, M., Chan, S.-K., Wade, A. (2010). When t-tests or Wilcoxon-Mann-Whitney tests won't do. Advances in Physiology Education 34: 128–133.
Melquist, W. E., Hornocker, M. G. (1983). Ecology of river otters in West Central Idaho. Wildlife Monographs, 83: 1–60.
Meredith, M., Ridout, M. (2017). overlap: Estimates of coefficient of overlapping for animal activity patterns. R package version 0.2.7.
Meyer, A., Kocher, T. D., Basasibwaki, P., Wilson, A. C. (1990). Monophyletic origin of Lake Victoria cichlid fishes suggested by mitochondrial DNA sequences. Nature 347: 550–553.
Mucci, N., Arrendal, J., Ansorge, H., Bailey, M., Bodner, M., Delibes, M., Ferrando, A., Fournier, P., Fournier, C., Godoy, J. A., Hájková, P., Hauer, S., Heggberget, T. M., Heidecke, D., Kirjavainen, H., Krueger, H.-H., Kvaloy, K., Lafontaine, L., Lanszki, J., Lemarchand, C., Liukko, U.-M., Loeschcke, V., Ludwig, G., Madsen, A. B., Mercier, L., Ozolins, J., Paunovic, M., Pertoldi, C., Piriz, A., Prigioni, C., Santos-Reis, M., Luis, T. S., Stjernberg, T., Schmid, H., Suchentrunk, F., Teubner, J., Tornberg, R., Zinke, O., Randi, E. (2010). Genetic diversity and landscape genetic structure of otter (Lutra lutra) populations in Europe. Conservation Genetics 11: 583–599.
Mucci, N., Randi, E. (2007). Sex identification of Eurasian otter (Lutra lutra) non-invasive DNA samples using ZFX/ZFY sequences. Conservation Genetics 8: 1479–1482
Nagelkerke, N. (1991). A note on a general definition of the coefficient of determination. Biometrika 78: 691–692.
Niedballa, J., Wilting, A., Sollmann, R., Hofer, H., Courtiol, A. (2019). Assessing analytical methods for detecting spatiotemporal interactions between species from camera trapping data. Remote Sensing in Ecology and Conservation 5: 272–285.
Ottino, P., Giller, P. (2004). Distribution, density, diet and habitat use of the otter in relation to land use in the Araglin Valley, Southern Ireland. Biology & Environment: Proceedings of the Royal Irish Academy 104: 1–17.
Pannach, D. (2011). Ein weiteres Vorkommen des Bibers (Castor fiber) in der Oberlausitz. Berichte der Naturforschenden Gesellschaft der Oberlausitz 19: 73–74.
Peakall, R., Smouse, P. E. (2006). GenAlEx 6: genetic analysis in Excel. Population genetic software for teaching and research. Molecular Ecology Notes 6: 288–295.
Peakall, R., Smouse, P. E. (2012). GenAlEx 6.5: genetic analysis in Excel. Population genetic software for teaching and research—an update. Bioinformatics 28: 2537–2539.
Peper, S., Peper, T. (1996). Verbreitung und Lebensraum des Fischotters in Sachsen: Kartierung und Bewertung der Lebensräume. In: Artenschutzprogramm Fischotter in Sachsen – Materialien zu Naturschutz und Landschaftspflege. Sächsisches Landesamt für Umwelt, Landwirtschaft und Geologie, Radebeul, pp. 17–24.
Pun, K.-M., Albrecht, C., Castella, V., Fumagalli, L. (2009). Species identification in mammals from mixed biological samples based on mitochondrial DNA control region length polymorphism. Electrophoresis 30: 1008–1014.
R Core Team (2018). R: A Language and Environment for Statistical Computing. R Foundation for Statistical Computing, Vienna, Austria.
Reid, D. G., Herrero, S. M., Code, T. E. (1988). River otters as agents of water loss from beaver ponds. Journal of Mammalogy 69: 100–107.
Reid, N., Thompson, D., Hayden, B., Marnell, F., Montgomery, W. I. (2013). Review and quantitative meta-analysis of diet suggests the Eurasian otter (Lutra lutra) is likely to be a poor bioindicator. Ecological Indicators 26: 5–13.
Reuther, C., Dolch, D., Green, R., Jahrl, J., Jefferies, D. J., Krekemeyer, A., Kucerova, M., Madsen, A. B., Romanowski, J., Roche, K., Ruiz-Olmo, J., Teubner, J., Trindade, A. (2000). Surveying and monitoring distribution and population trends of the Eurasian otter (Lutra lutra). Guidelines and evaluation of the standard method for surveys as recommended by the European section of the IUCN/SSC Otter Specialist Group. Habitat 12: 1–52.
Ridout, M. S., Linkie, M. (2009). Estimating overlap of daily activity patterns from camera trap data. Journal of Agricultural, Biological, and Environmental Statistics 14: 322–337.
Romanowski, J. (2013). Detection of otter (Lutra lutra L.) signs in a survey of Central and Eastern Poland: methodological implications. Polish Journal of Ecology 61: 597–604.
Romanowski, J., Brzeziński, M., Żmihorski, M. (2013). Habitat correlates of the Eurasian otter Lutra lutra recolonizing Central Poland. Acta Theriologica 58: 149–155.
Romanowski, J., Zając, T., Orłowska, L. (2010). Wydra ambasador czystych wód. Kraków: Fundacja Wspierania Inicjatyw Ekologicznych, Kraków
Romanowski J, Brzeziński M, Cygan JP (1996). Notes on the technique of the otter field survey. Acta Theriol., 41:199–204
Schager, E., Peter, A. (2001). Bachforellensömmerlinge Phase I. Netzwerk Fischrückgang Schweiz 315.
Schwab, G., Schmidbauer, M. (2001). Kartieren von Bibervorkommen und Bestandserfassung. http://www.gerhardschwab.de/Veroeffentlichungen/Kartieren_von_Bibervorkommen_und_Bestandserfassung_2009.pdf
Retrieved 2019/10/29.
Semjonow, B. T. (1951). The river beaver in the Arkhangelsk district. Trudy VNIO 11 (in Russian).
Sidorovich, V. E., Jędrzejewska, B., Jędrzejewski, W. (1996). Winter distribution and abundance of mustelids and beavers in the river valleys of Białowieża Primeval Forest. Acta Theriologica 41: 155–170.
Steyer, K., Kraus, R. H. S., Mölich, T., Anders, O., Cocchiararo, B., Frosch, C., Geib, A., Götz, M., Herrmann, M., Hupe, K., Kohnen, A., Krüger, M., Müller, F., Pir, J. B., Reiners, T. E., Roch, S., Schade, U., Schiefenhövel, P., Siemund, M., Simon, O., Steeb, S., Streif, S., Streit, B., Thein, J., Tiesmeyer, A., Trinzen, M., Vogel, B., Nowak, C. (2016). Large-scale genetic census of an elusive carnivore, the European wildcat (Felis s. silvestris). Conservation Genetics 17: 1183–1199.
Sulkava, R. T. (2006). Ecology of the otter (Lutra lutra) in central Finland and methods for estimating the densities of populations. University of Joensuu.
Swimley, T. S., Brooks, R. P., Serfass, T. L. (1999). Otter and beaver interactions in the Delaware Water Gap National Recreation Area. Journal of the Pennsylvania Academy of Science 72: 97–101.
Swinnen, K. R., Hughes, N. K., Leirs, H. (2015). Beaver (Castor fiber) activity patterns in a predator-free landscape. What is keeping them in the dark? Mammalian Biology – Zeitschrift für Säugetierkunde 80: 477–483.
Taberlet, P., Griffin, S., Goossens, B., Questiau, S., Manceau, V., Escaravage, N., Waits, L. P., Bouvet, J. (1996). Reliable genotyping of samples with very low DNA quantities using PCR. Nucleic Acid Research 24: 3189–3194.
Tumlison, R., Karnes, M., King, A. W. (1982). The river otter in Arkansas: II. Indications of a beaver-facilitated commensal relationship. Proceedings of the Arkansas Academy of Science 36: 73–75.
Ulevičius, A., Balčiauskas, L. (1999). Spatial relations among semi-aquatic mammals on the riverside. Acta Zoologica Lituanica 9: 42–48.
Valière, N. (2002). GIMLET: a computer program for analysing genetic individual identification data. Molecular Ecology Notes 2: 377–379.
Venables, W. N., Ripley, B. D. (2002). Modern Applied Statistics with S. Fourth Edition. Springer, New York.
Vorel, A., Válková, L., Hamšíková, L., Maloň, J., Korbelová, J. (2008). The Eurasian beaver population monitoring status in the Czech Republic. Natura Croatica 17: 217–232.
Waits, L. P., Luikart, G., Taberlet, P. (2001). Estimating the probability of identity among genotypes in natural populations: cautions and guidelines. Molecular Ecology 10: 249–256.
Zeileis, A., Kleiber, C. (2018). countreg: Count data regression. R package version 0.2-1.
Zeileis, A., Kleiber, C., Jackman, S. (2008). Regression models for count data in R. Journal of Statistical Software 27: 8.
Resume: Influence du Castor Eurasien (Castor fiber) sur la Loutre Eurasienne (Lutra lutra) évaluée par Estimation de la Densité d’Activité dans des Habitats Anthropogeniques de l’Est de l’Allemagne
Les espèces de mammifères semi-aquatiques comme le Castor eurasien Castor fiber (LINNAEUS, 1758) et la loutre eurasienne Lutra lutra (LINNAEUS, 1758) se retrouvent simultanément dans les écosystèmes européens d'eau douce. La connaissance de l'interaction entre les deux espèces peut être utile pour prédire la distribution et la colonisation des espèces. La présente étude compare les densités d'activité des castors et des loutres durant la saison hivernale 2015/2016 dans des habitats anthropiques de l'est de l'Allemagne. L'activité du castor a été évaluée à l'aide des arbres coupés, l'activité de la loutre à l'aide d’épreintes. Les résultats ont indiqué que l'activité des loutres n'était que légèrement influencée par l'activité des castors (2% d'activité des loutres en moins pour une augmentation unitaire de l'activité des castors, P = 0,013), probablement parce que la zone d'étude fournit déjà des terrains de chasse optimaux en terme d'approvisionnement en poisson pour la loutre. . Des résultats supplémentaires obtenus à partir des données bisannuelles des pièges photographiques, recueillis entre 2015 et 2017, ont indiqué une ségrégation temporelle des deux espèces en période d’étiage (P <0,0001). Selon nos estimations de la taille de la population de loutres à l'aide de marqueurs d’ADN microsatellites et de raréfaction, la zone d'étude est densément peuplée en loutres (1,46 loutre par km de berge), tandis que la taille de la population de castors, basée sur l'identification des territoires, indiquait des conditions d'habitat sous-optimales (1,15 castor par km de berge).
Revenez au dessus
Resumen: Influencia del Castor Europeo (Castor Fiber) en la Nutria Eurasiática (Lutra Lutra), evaluada mediante Estimaciones de Densidad de Actividad e Habitats Antropogénicos en el Este de Alemania
Las especies de mamíferos semiacuáticos Castor Europeo Castor fiber LINNAEUS, 1758, y la nutria Europea Lutra lutra (LINNAEUS, 1758) ocurren simultáneamente en ecosistemas europeos de agua dulce. El conocimiento sobre sus interacciones mutuas puede ser útil para predecir las distribuciones y colonización de ambas especies. Este estudio compara las densidades de actividad de castore y nutrias durante el invierno 2015/2016, en hábitats antropogénicos en el este de Alemania. La actividad de los castores fue evaluada mediante cortes de árboles, y la de las nutrias mediante fecas. Los resultados indicaron que la actividad de las nutrias estuvo influida sólo levemente por la activida de los castores (2 % menos de actividad de nutrias por cada unidad de incremento de la actividad de castores, P=0.013), probablemente porque el área de estudio ya proporciona espacios de cacería óptimos en términos de provisión de peces para las nutrias. Resultados adicionales obtenidos de datos bianuales de cámaras-trampa, entre 2015 y 2017, apuntan a una segregación temporal de ambas especies durante los períodos de aguas bajas (P<0.0001). De acuerdo a nuestras estimaciones de tamaño poblacional de nutrias usando marcadores y rarefacción de microsatélites de ADN, el área de estudio está densamente poblada de nutrias (1.46 nutrias por km de costa de río), mientras que el tamaño poblacional de castores, basado en identificación de territorios, indicó condiciones subóptimas de hábitat (1.15 castores por km de costa)
Vuelva a la tapa


