IUCN/SSC Otter Specialist Group Bulletin

©IUCN/SCC Otter Specialist Group
Volume 38 Issue 4 (August 2021)
Citation: Carvalho Junior, O., Barbosa, P.M.L. and Birolo, A.B. (2021). Status of Conservation of Lontra longicaudis (Olfers, 1818) (Carnivora: Mustelidae) on Santa Catarina Island. IUCN Otter Spec. Group Bull. 38 (4): 186 - 201
Status of Conservation of Lontra longicaudis (Olfers, 1818) (Carnivora: Mustelidae) on Santa Catarina Island
Oldemar Carvalho Junior1*, Procássia Maria L. Barbosa1 and Alesandra Bez Birolo2
1Instituto Ekko Brasil, Caixa Postal 10121 - R. Henrique Veras do Nascimento, 82 - Conceição Lagoon - Florianópolis/SC - 88062-970
2Departamento de Zootecnia e Desenvolvimento Rural, Universidade Federal de Santa Catarina, Florianópolis, SC, Brasilo
* Corresponding Author Email: ocjunior@ekkobrasil.org.br
((Received 20th January 2021, accepted 15th January 2021)
Abstract: Neotropical otters (Lontra longicaudis) are semi-aquatic mammals classified as “Near threatened” by the International Union for Conservation of Nature (IUCN), facing various threats against their survival, such as habitat fragmentation, water pollution, conflicts with fishermen, or attacks by dogs. A total of 9.531 scats were collected monthly over nine years, covering 14 years, from 2003 to 2017, in six different areas of study in Santa Catarina Island, Brazil. Frequency analysis through non-parametrical statistical tests and a polynomial regression model was applied. A linear model was also used following criteria and standards defined by the IUCN. Both methods were in agreement, showing a significant decrease in the number of Neotropical otter’s faeces over this period. Because the modifications of the environment were constant during the last 14 years, the criterion to be adopted, according to the IUCN Red List, is A2. Therefore, the average reduction in the number of otter droppings over the past 14 years, or three generations, suggests that the population is critically endangered (CR).
Keywords: Mustelidae, IUCN Red List, population, biodiversity, distribution, shelters.
INTRODUCTION
The present work aims to provide information to update the conservation status of Neotropical otters (Lontra longicaudis) in the Brazilian state of Santa Catarina. As the area where this otter species live is quite broad, about 80 km long by 60 km wide (Carvalho Junior, 2016), the results presented here can be considered representative for the Santa Catarina Island. The study area represents 50% (212 km2) of the Island, which has 424,4 km2.
The Neotropical otter is considered a threatened species by the Convention on International Trade in Endangered Species of Wild Fauna and Flora (CITES), of which Brazil is a signatory. The International Union for Conservation of Nature (IUCN) classifies the species as Near Threatened. According to Rodrigues et al. (2013), the species is vulnerable in the Atlantic Forest, an essential biome of the Brazilian state of Santa Catarina.
The Atlantic Forest used to cover 85% of the area of the Santa Catarina state. Today it occupies only 17% of the original area, indicating a critical situation of this biome. During 2017 and 2018, the state lost 9.05 km2 of the Atlantic Forest, compared to 5.95 Km2 from 2016 to 2017, which resulted in an increase of 52% in deforestation for this biome in the period (SOS Mata Atlântica/INPE, 2018).
In Brazil, the Wildlife Protection Law (Law N° 5.197, 3/01/1967) prohibits the use, pursuit, destruction, hunting, or harvesting of wild animals, emphasizing hunting and fishing, without specifying any particular species. The law does not explicitly mention the otter as a protected species. On the other hand, reports indicate that these animals are not popular in some sectors of society. Fishermen and fish farmers, for example, complain that otters are harmful, damaging nets, eating farmed fish, and damaging oyster and shellfish farms.
Due to the top predator role, otters provide an exciting example of biomagnification, making them more sensitive to aquatic ecosystems’ negative impacts as water pollution. This biomagnification is useful to warn of the need to protect the various habitats used by otters, such as estuaries, freshwater lakes, rivers, mangroves, bays, marshes, and coastal islands.
In addition to water pollution, living close to anthropogenic activities like agriculture, livestock, or fishing, leads Neotropical otters to face conflicts with human society, mostly with fishermen (Barbieri et al., 2012, Castro et al., 2014) and deal with habitat fragmentation (González and Utrera, 2001). Despite being top predators, attacks on adults and offspring could also occur in the study area, from Caiman latirostris (broad-snouted caiman) and feral dogs. In fact, González and Utrera (2001) describe otter deaths caused by dogs in Venezuela.
The loss of habitat in the study area has been shown to be irreversible, giving rise to increasing water extraction for human consumption and increasingly intense mass tourism (Campos, 2004; Gomez et al., 2014; Chaves, 2015; Covello et al., 2017). Also, condominiums multiply, increasing the number of people per square meter and the number of cars on highways built without protective measures for the passage of fauna.
The impact on the otters over the years in the studied areas are mostly of anthropic origin, mainly run over and conflicts with fishermen. At the base of the Ekko Brasil Institute/Otter Project, dead otters were received over nine years in the south of the Island. From this total, 11 otter corpses died due to car accidents, found next to highways (3 animals); physical aggressions, found floating on the waters (2 animals); drowning in fish traps (5 animals), and one animal was the victim of a domestic dog attack. The Neotropical otter can be affected by other causes, such as the accumulation of heavy metals and food reduction in lagoons and rivers, construction of dams, the degradation of riparian forests, and natural disasters.
These different threats may have a more negative impact on L. Longicaudis than global warming itself, for which Neotropical otter is a less sensitive otter species (Cianfrani et al., 2018). Threats decrease population size (Pacifici et al., 2013), affecting population genetic diversity (Trinca et al., 2007, 2012). Because they belong to the Brazilian natural heritage, the otter's preservation is a question for academic, economic, and the social development of the country (Carvalho Junior, 2016). To implement efficient conservation strategies, it is mandatory to correctly evaluate the distribution of otter subpopulations and estimate the intensity of the species in the study area.
The term intensity, used here, is different from the definition of frequency. The intensity of the species’ presence in the monitored areas is a strategy used in several countries in Europe since the 1960’s. This model’s importance is due to the difficulty of observing the otter in the wild and the costs and logistics associated with DNA studies. Besides that, the use of intensity comes from previous work on the flow of energy, the species’ ecological role, and the species’ ecological services (Carvalho Junior, 2016). In this case, the otter’s presence is related to the flow of energy in the system and its concentration at the top of the food chain. It is seen from the receiver’s point of view, not the sender, as Odum (1996) defined. Therefore, the otter’s value to the receiver means how much he is willing to pay, a market value.
On the other hand, the value from the issuer’s point of view represents the total amount spent to create the otter, including solar radiation and producers. We opted for the receiver’s point of view to better illustrate the differences in values by society attributed to the otter. The otter’s value for an ecovolunteer who participates in the Ecovolunteer Program of Projeto Lontra, for example, is much greater than the value attributed by a fisherman. This perception is intrinsic to the feeling that the otter causes within the human being. In this sense, the term intensity is also used here to reflect the energy caused by the species’ presence in different social groups.
In other words, the intensity of the otter’s presence can indicate the health of the functioning of the different compartments of the ecosystem, responsible for the transformation and transfer of energy. In physics, the intensity is related to the variation in the flow of energy over time. The greater the intensity, the greater the flow of energy in space. It reflects the strength of something that can be measured (https://dictionary.cambridge.org). Therefore, intensity can be seen here due to the frequency, but with a more ecological and applied interpretation for public policy.
Neotropical otters are organized in the form of a metapopulation, small subpopulations separated by geographic and human barriers, but maintaining contact through ecological corridors. On Santa Catarina Island, a preliminary study conducted in the Peri Lagoon (Carvalho Junior, 2007) estimated 5 to 11 individuals, through DNA analysis, in 5 km2 of water surface and a perimeter of 11 km. However, in terms of seasonal intensity and movements through ecological corridors, the Island’s population has not yet been investigated.
The determination of Neotropical otter status is based on studies that have been developed in Europe with the Eurasian otter Lutra lutra since the 1970s. These studies are based on Erlinge’s (1967) methods, described by Jeffries, as in Strachan and Jefferies (1996). The following works, Chapman and Chapman (1982), Strachan and Jefferies (1996), Green and Green (1997), Hamilton and Rochford (2000), Reuther (2000), Chanin (2003a, 2003b), Bailey and Rochford (2006), were successful in demonstrating the distribution and presence of otter in several habitats, determining the tendency of increase or decline of subpopulations.
The study design consisted of a preliminary survey in the first year, followed by monitoring in the following years. The preliminary survey served as a preparation for the monitoring effort, define the sampling sites, while the monitoring itself consisted of collecting and analyzing the data. This methodology has already been successfully used in other sites (Carvalho Junior. 2016; Carvalho Junior and Birolo, 2019), creating a baseline for future monitoring of otter populations in southern Brazil.
By analyzing the intensity of the species’ presence, based on sightings and signs such as faeces, conducted over nine years, covering 14 years, but not in all locations of Santa Catarina Island, this paper seeks to answer three main questions:
- Are there any favorite places for otters in each location?
- Is there any seasonal variation in the presence of otters?
- Is there a significant decrease in the intensity of otter presence on the Island since 2003?
It is hoped that this methodology can be replicated in other federation states, assisting in management plans for the species in Brazil.
STUDY AREA
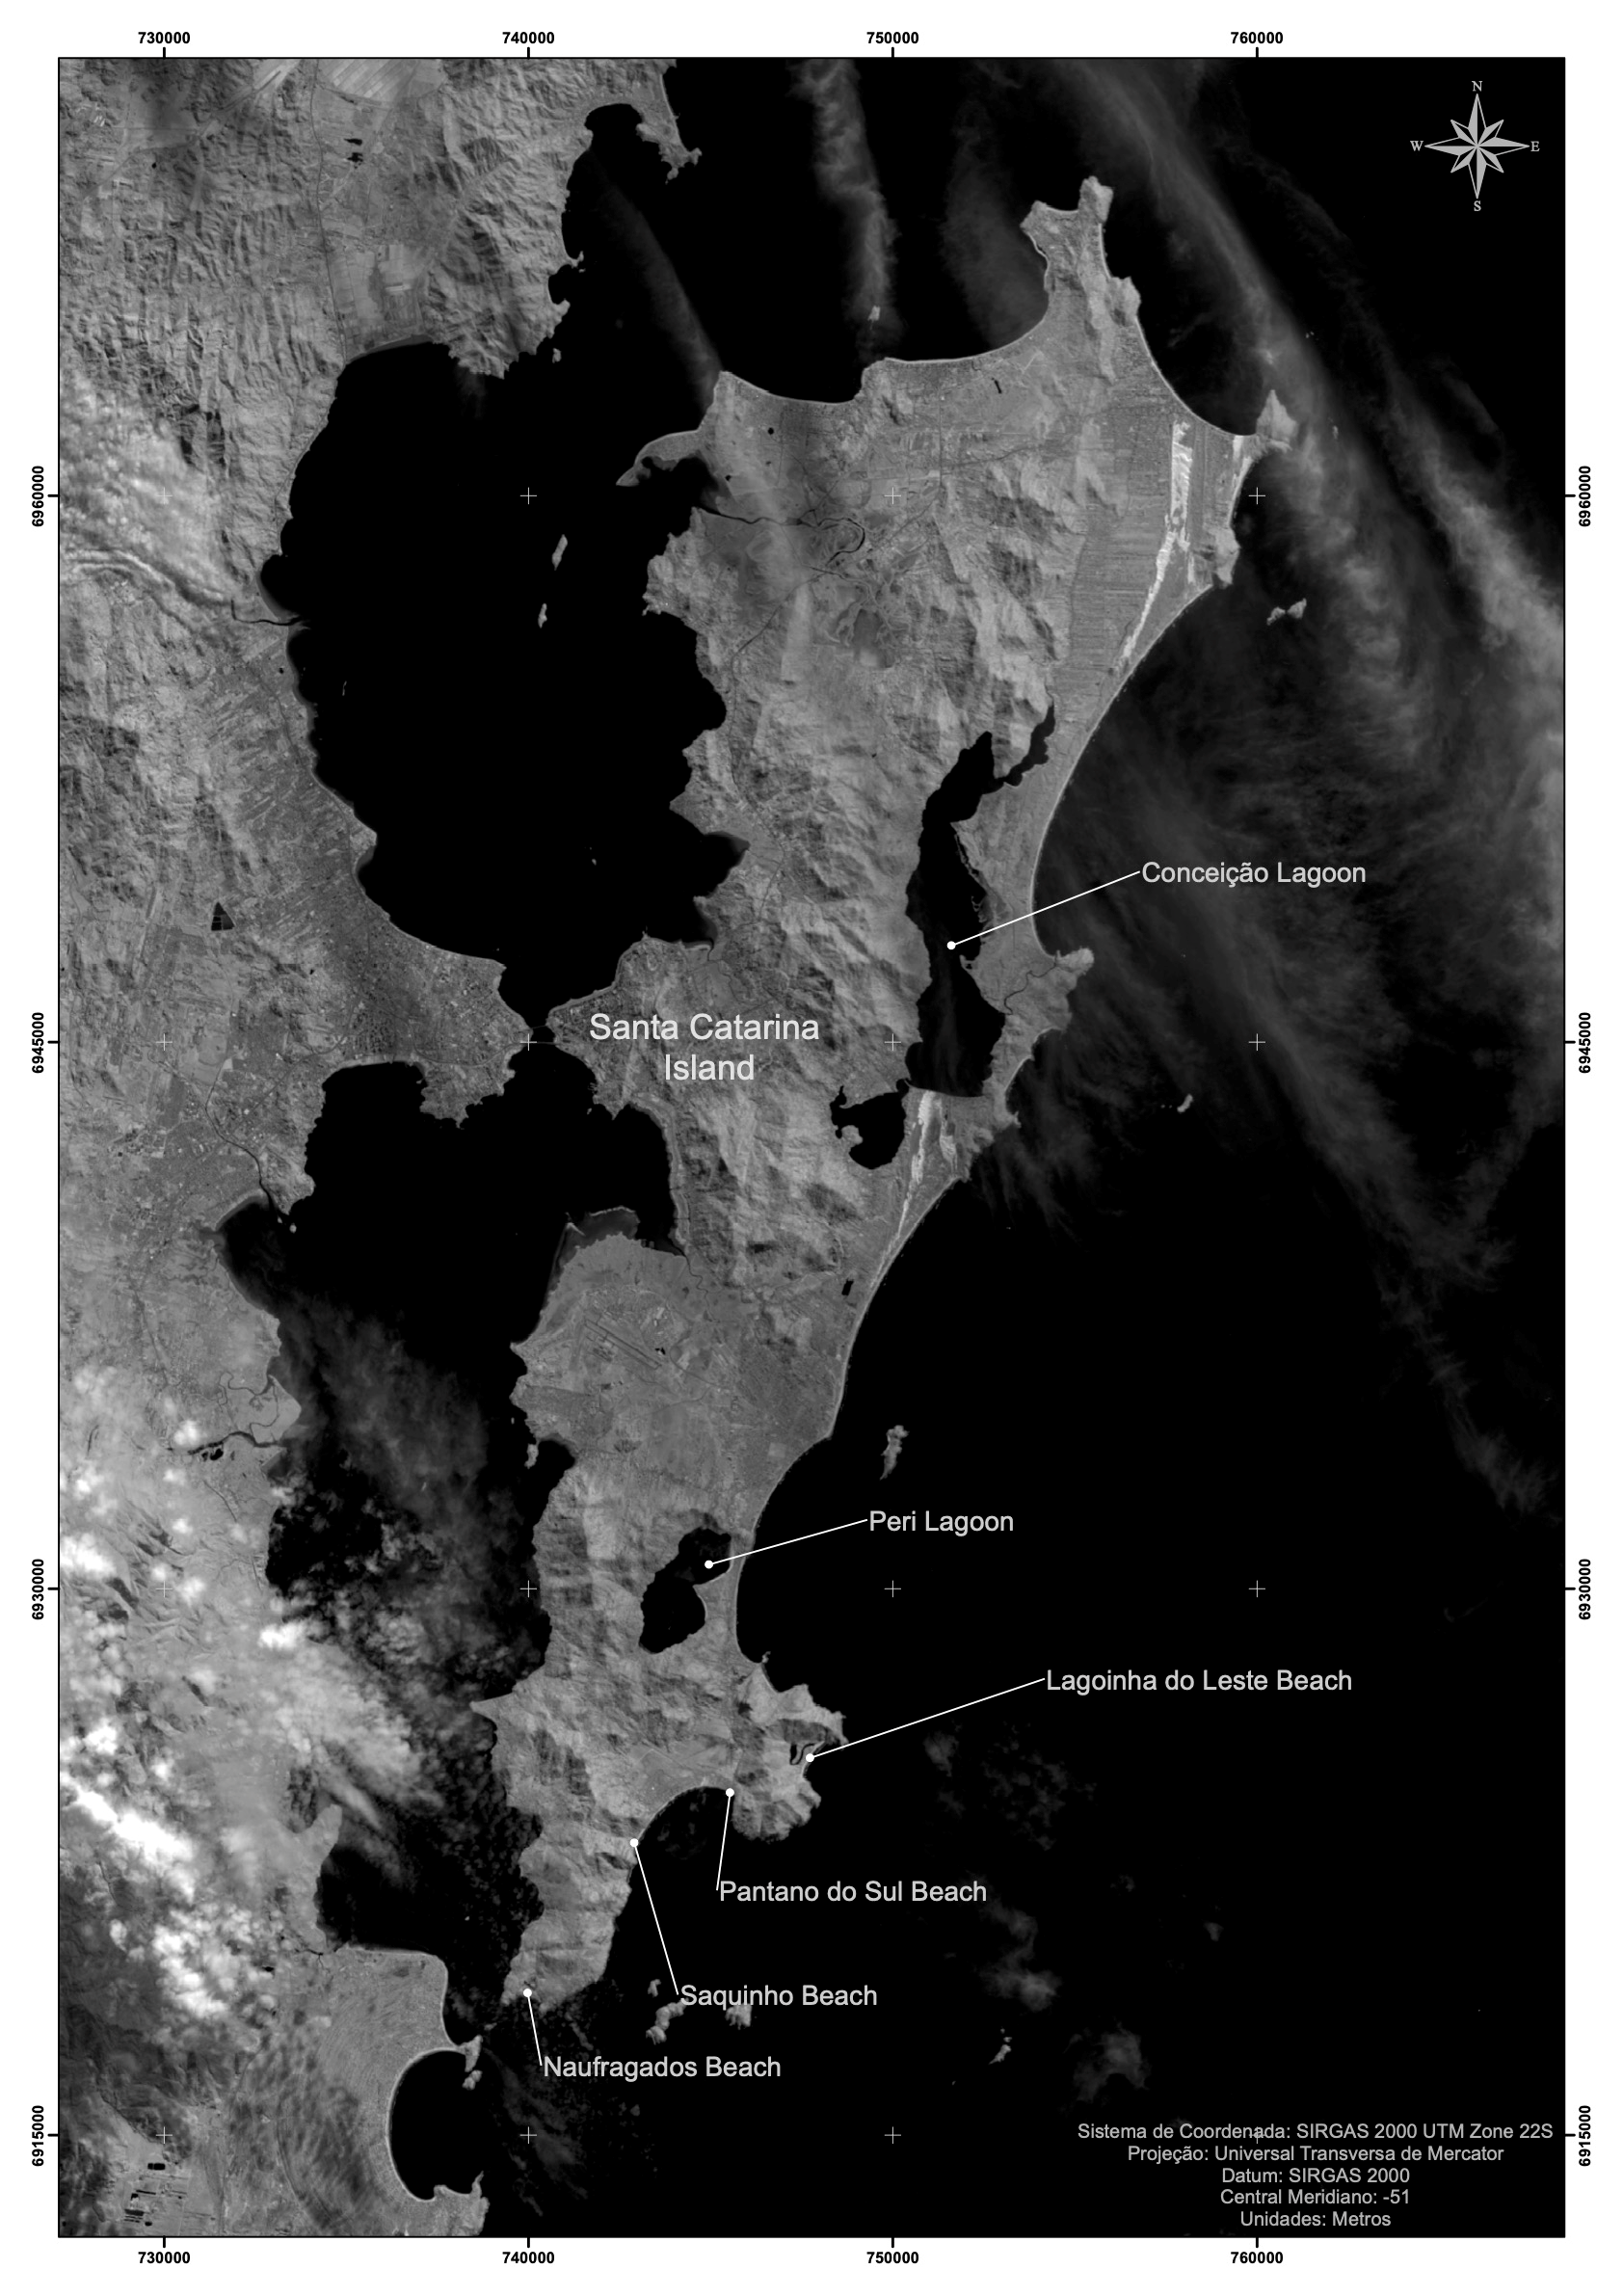
Santa Catarina Island is the largest island of the Santa Catarina State, located parallel to the mainland and separated by a narrow channel (Figure 1). It has an average length of 54 km and an average width of 18 km. Bays, promontories, smaller islands, and lagoons are standard features in the study area. The most important water bodies in the Santa Catarina Island are the Peri Lake (5.1 km2) and Conceição Lagoon (19.71 km2) (Carvalho Junior et al., 2012).
METHODS
Naufragados, Saquinho, Pântano do Sul, and Lagoinha do Leste are rocky coastlines, and Conceição Lagoon and Peri Lagoon are salt and freshwater lagoons, respectively. These sampling areas were defined after a systematic evaluation of attractive otter habitats across the Island, selected after direct observations of the animals or indirect evidence of the species’ presence such as faeces and footprints.
Data were collected from 2003 to 2017. In 2003, only Peri Lagoon was considered. In 2004, Naufragados, Pântano do Sul, Lagoinha do Leste, and Conceição Lagoon, were added. In 2005, Saquinho joined the other five sampling sites to obtain a total of six different areas. Each year, the data were collected once a month in each area.
The expeditions to otter habitats were conducted on foot by trails or by water using canoes. Otter presence was defined by signs such as faeces and footprints inside the dens and surroundings. During each field trip, the total number of otter faeces was counted for each location. These faeces were collected as not to count them again in the following month.
Statistical analysis
As the number of otter faeces did not follow a normal distribution, non-parametrical statistical tests were applied using the R software (R Studio 1.0). A Kruskal-Wallis test was done across the dataset to investigate any significant difference between the conditions tested. In the case of differences, the paired Wilcoxon test was run to know which conditions were significantly different from the others. Finally, a Loess polynomial regression model was applied to the data’s evolution curve, with a Holm adjustment, using R Studio software (RStudio 1.0.44 and “ggplot2” package). The objective was to define if the number of otter faeces was increasing or decreasing over the years. For all statistical analyzes, differences were considered significant at P< 0.05.
As for the intensity of the species’ presence, the number of faeces is also used to infer if the otter population is declining. The use of indirect data is not uncommon to infer the population of a given species. IUCN suggests using indirect data as long as it is of the same type (IUCN Standards and Petitions Subcommittee, 2019). The objective was to find the population trends of at least three generations. This trend must be justified by characteristics of life history, habitat biology, a pattern of exploitation, or other threatening processes.
A linear model is appropriate when the taxon is threatened, for example, with habitat loss, and a similar-sized area of habitat is lost every year that could lead to a linear decline in the number of individuals. An exponential model should be used in the case of hunting mortality that would result in a proportion of individuals subtracted from the population.
The polynomial regression model shows a regular decrease over the years. The linear model is used in the present case as the otter is not systematically hunted in the study area but subject to retaliation by fishermen and aquaculture farmers, loss habitats, or run over by cars on highways. The analysis follows criteria and standards defined by the IUCN (IUCN Standards and Petitions Subcommittee, 2019) under the official IUCN Red List Categories and Criteria booklet (IUCN 2001, 2012b).
RESULTS
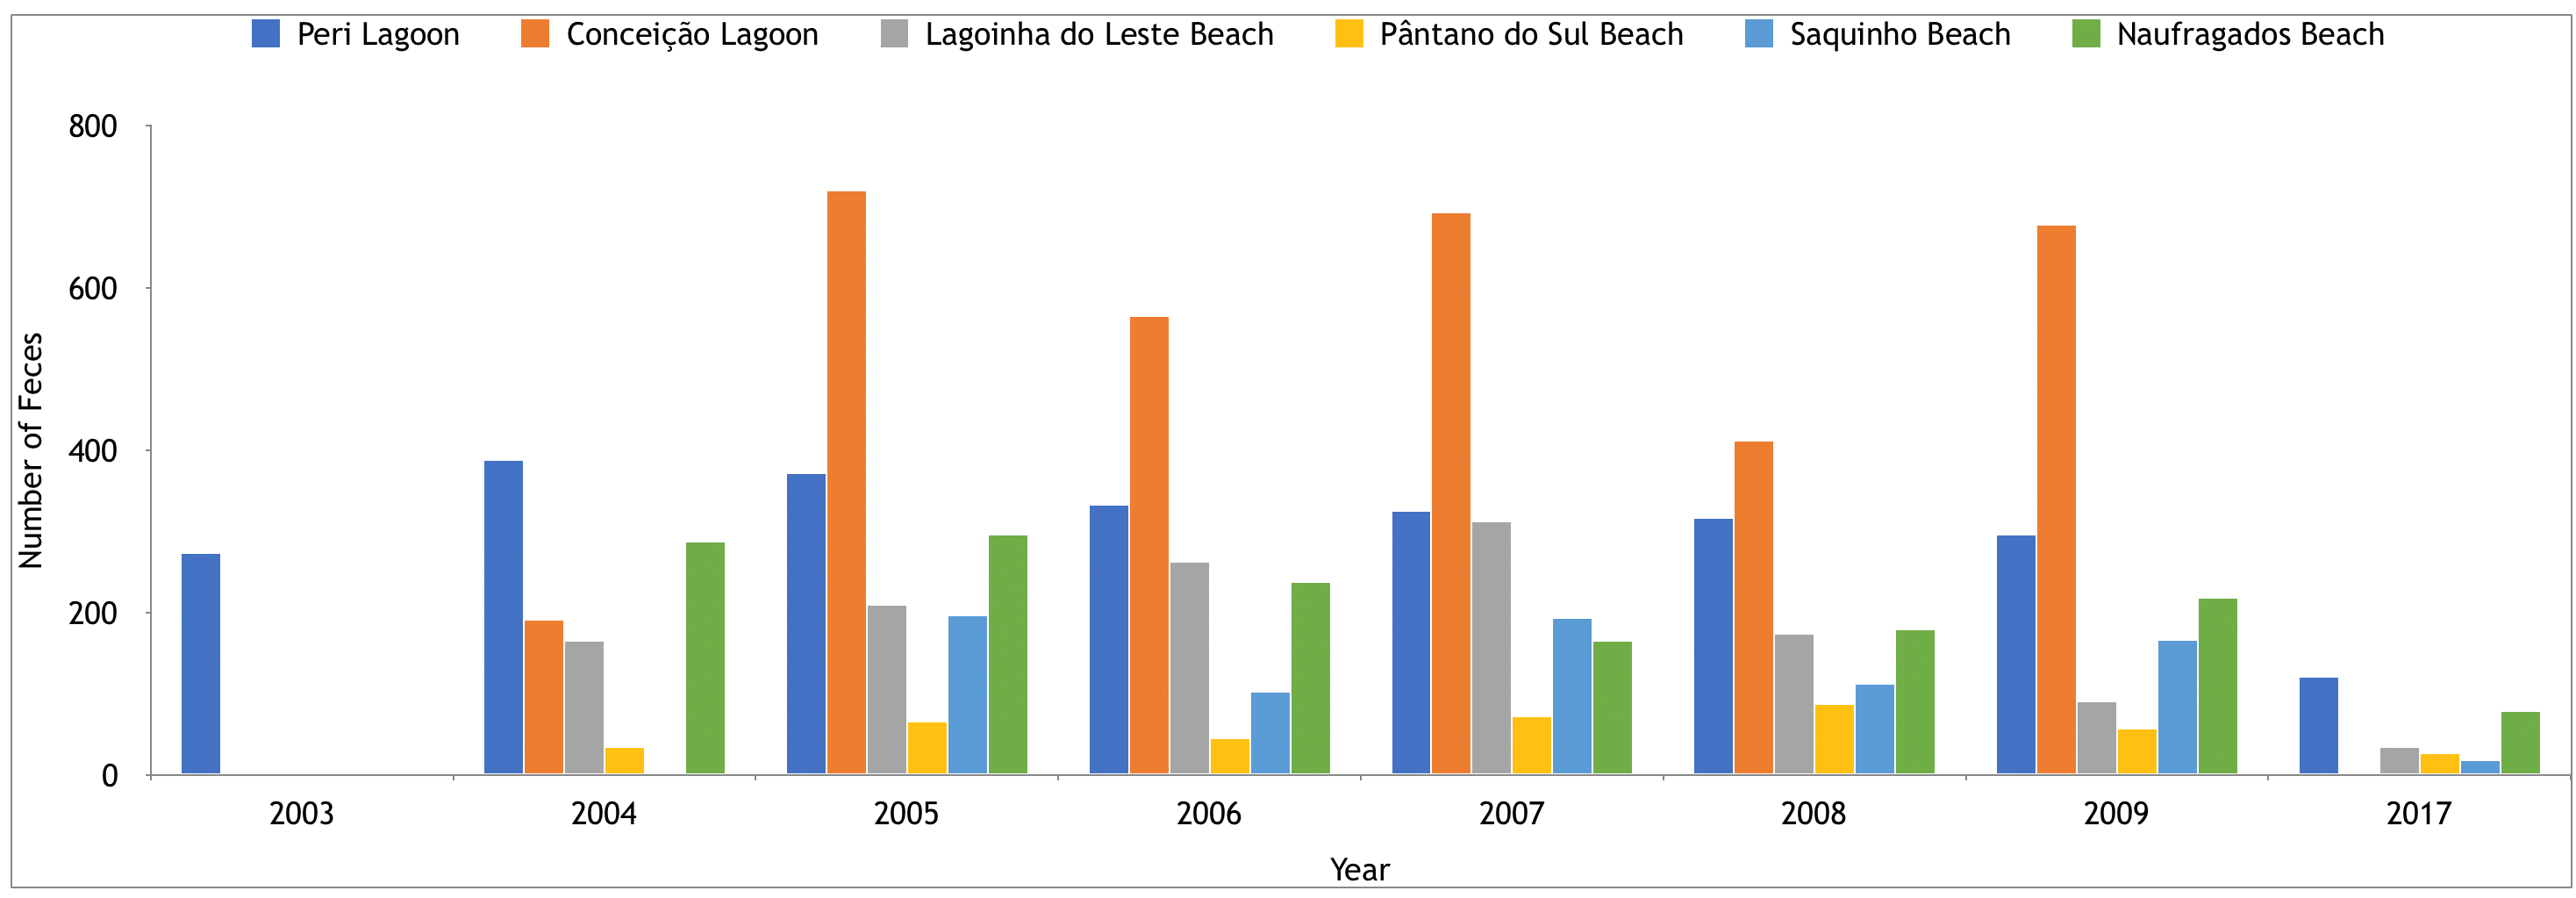
A total of 9,531 scats were collected. There were 3,260 faeces in Conceição Lagoon, from 72 field trips: 2,426 in Peri Lagoon, from 96 excursions in the field; 1,455 in Naufragados, from 84 excursions; 1,252 in Lagoinha do Leste, from 84 excursions; 793 in Saquinho, from 67 excursions; and 335 faeces in Pântano do Sul, from 72 excursions. Figure 2 shows the distribution of Neotropical otter faeces over the years.
The intensity of otter presence in these areas varied significantly between the sites studied over the years. Conceição Lagoon presented the highest number of otter faeces, followed by Peri Lagoon, but only between 2005 and 2009. In 2004, Peri Lagoon ranked first and Conceição Lagoon second, and in 2017 no data were collected in Conceição Lagoon.
Naufragados, Lagoinha do Leste, and Saquinho always presented smaller numbers of otter faeces than in Conceição Lagoon, and Peri Lagoon, with the position changing over the years (Table 1). Concerning Pântano do Sul, this was always the place with the lowest number of otter faeces between 2004 and 2009. In 2017 Saquinho occupied the last position. Table 1 exhibits the difference in the number of faeces between the different areas and their respective P-values.
A Kruskal-Wallis test indicated that presence intensity varied significantly between locations (P=8.772e-08; P=3.279e-09; P=1.049e-09; P=5.146e-10; P=0.002995; P=3.919e-08; and P=5,446e-07) and a pairwise Wilcoxon test with a Holm adjustment allowed to underline which ones (*0.01<P<0.05; 0.001<P<0.01; *** P <0.001) (Figure 3).
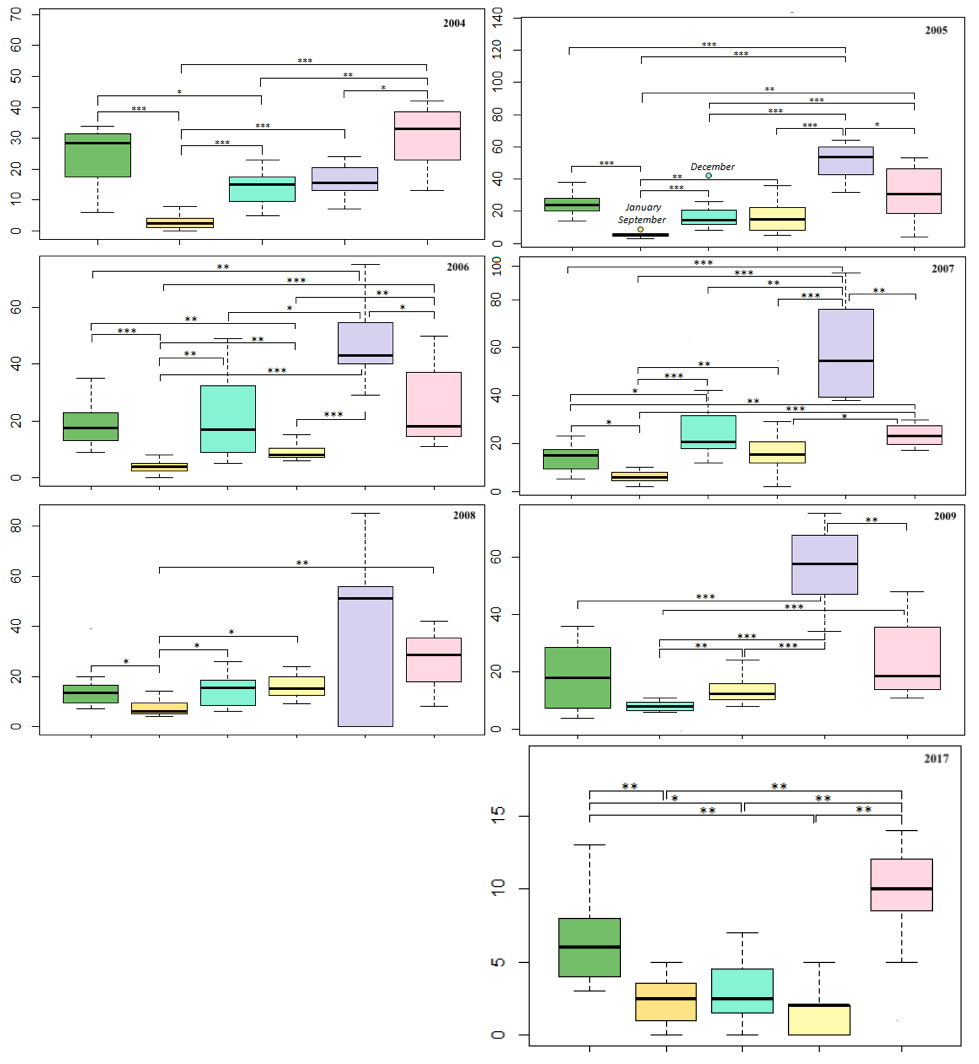
Conceição Lagoon generally showed the highest number of otter faeces, and Peri Lagoon was the second most preferred site. These positions were constant since 2005, but they were inverted in 2004. Naufragados, Lagoinha do Leste, and Saquinho had fewer otter faeces, and their relative order changed through the years. Finally, Pântano do Sul was always the site with the lowest number of otter faeces since 2004 and significantly equal to Lagoinha do Leste and Saquinho in 2017 (Table 1) (Figure 3).
Considering each year, in a single data set (Figure 4), the intensity of otter presence also varied significantly between sites (P<2,2e-16). The number of otter faeces sampled in Conceição Lagoon was significantly higher than in Peri Lagoon (P=9,60e-08), Naufragados (P=3.70e-12), Lagoinha do Leste (P=12), Saquinho (P=1.30e-13) and Pântano do Sul (P<2e-16). The number in Peri Lagoon was significantly higher than in Naufragados (P=0.00075), Lagoinha do Leste (P=2.70e-07), Saquinho (P=1.00e-09), and Pântano do Sul 2e-16). In Naufragados, the number was significantly higher than in Saquinho (P=0.00252), and Pântano do Sul (P<2e-16) but was not significantly different from Lagoinha do Leste. In Lagoinha do Leste, the number was significantly higher than in Pântano do Sul (P=1.80e-12), but it was not significantly different from Saquinho. Finally, the number of otter faeces sampled in Saquinho was also significantly higher than in Pântano do Sul (P=3.70e-08) (see Table 1).
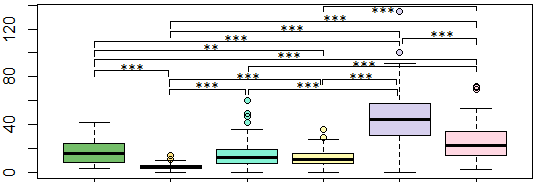
A Kruskal-Wallis test indicated that presence intensity varied significantly between locations (P<2.2e-16), and a pairwise Wilcoxon test with a Holm adjustment allowed to underline which ones (*0.01<P<0.05; 0.001<p<0.01; *** P<0.001). Naufragados (green), Pântano do Sul (orange), Lagoinha do Leste (turquoise), Saquinho (yellow), Conceição Lagoon (purple), and Peri Lagoon (pink).
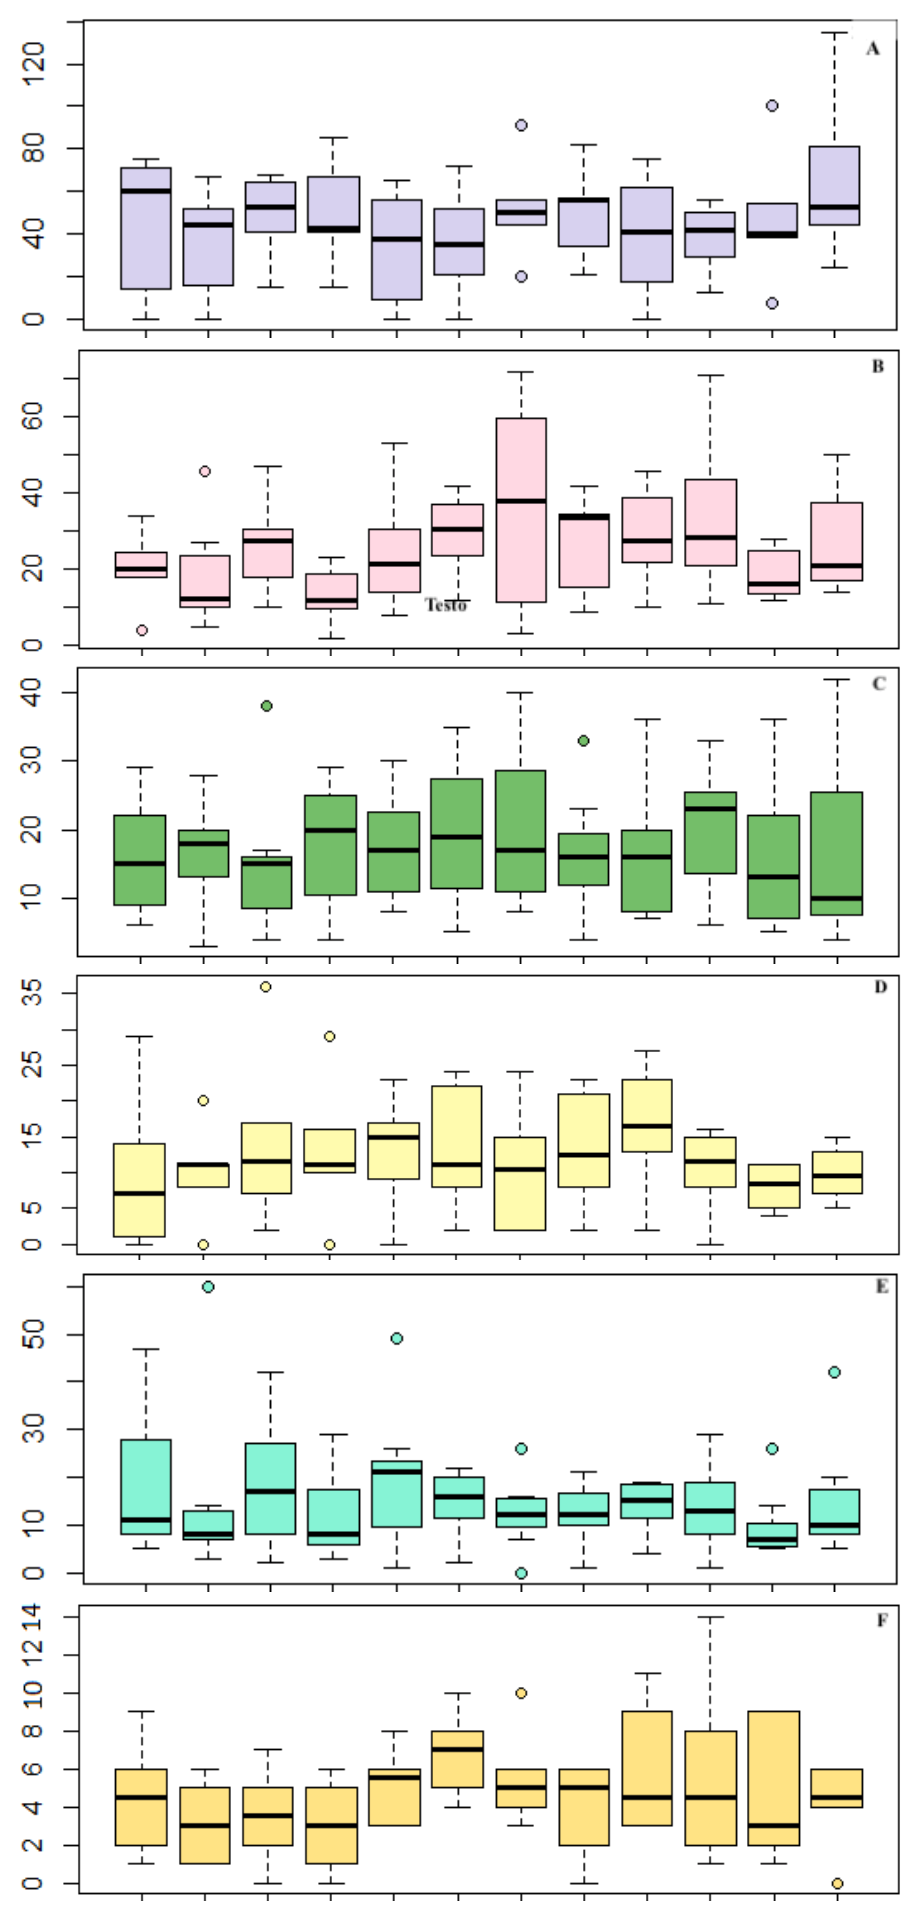
No difference in the present intensity of otters was shown between the different months, over the years 2004, 2005, 2006, 2007, 2008, 2009, and 2017, so it prevented us from underlining any seasonal variation, either considering each sampling area separately (Figure 5) or all areas in the same dataset (Figure 6).

Presence Intensity of Otters through Years
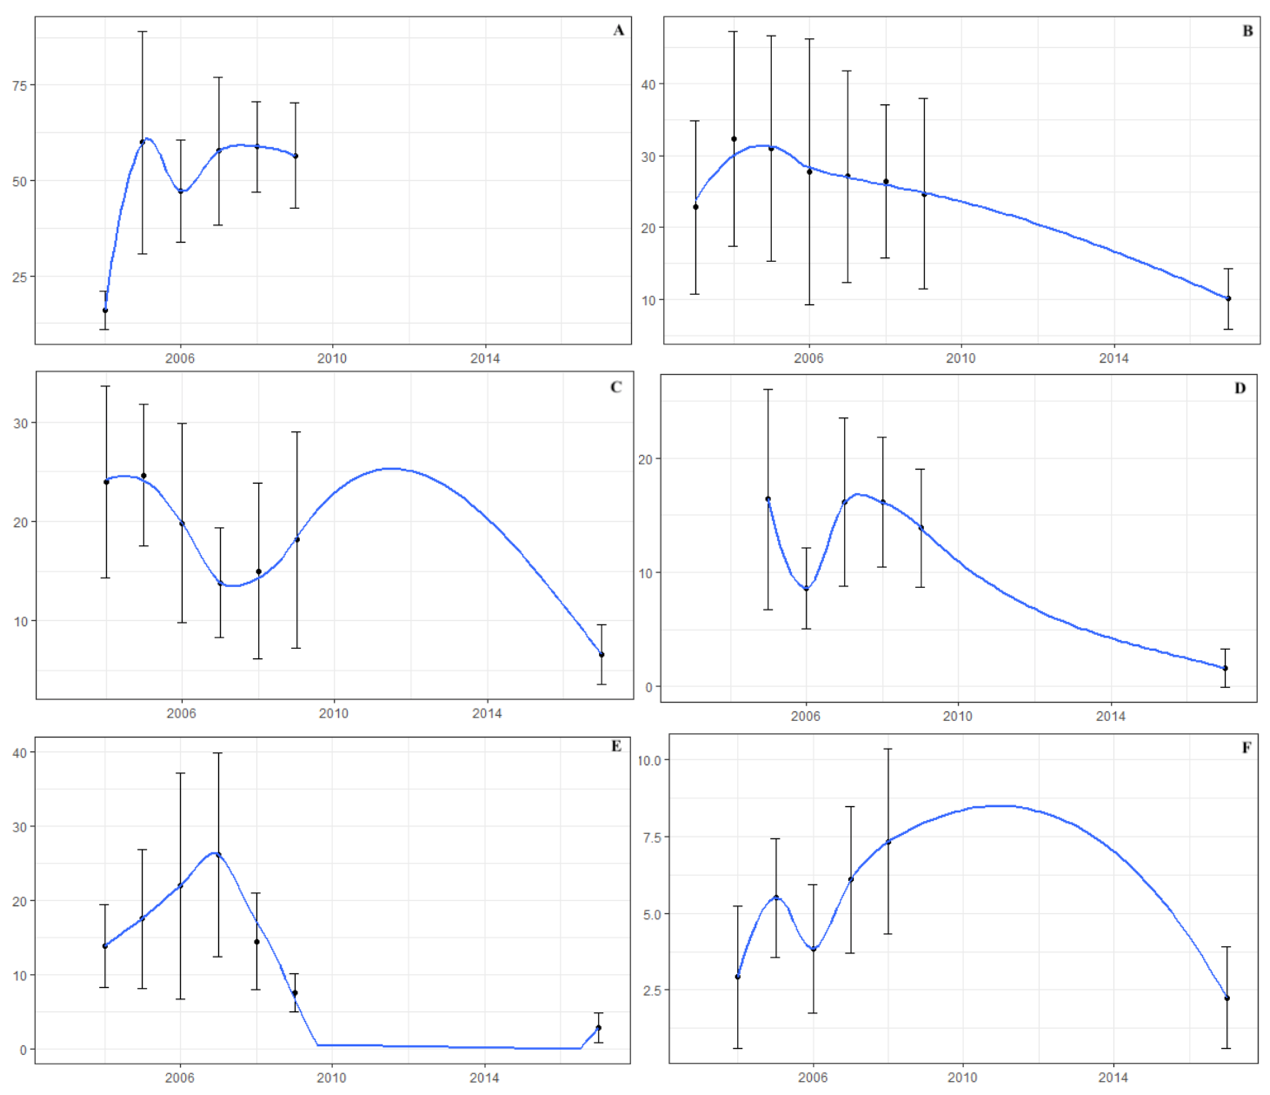
In Conceição Lagoon (Figure 7A), the regression model first showed an increasing number of sampled faeces between 2004 and 2005, then a decrease from 2005 to 2006, and again an increase after 2006 was stabilized in 2009. Since 2009, the lack of data did not allow us to investigate the trend in presence intensity. In Peri Lagoon (Figure 7B), the regression model first showed an increasing number of sampled faeces between 2003 and 2005 and then decreased from 2005 to 2017. In Naufragados (Figure 7C), the regression model showed first an increasing number of sampled faeces between 2004 and 2007, then an increase between 2007 and 2011, followed by a decrease until 2017.
In Saquinho (Figure 7D), the regression model showed first a decreasing number of sampled faeces between 2005 and 2006, then an increase between 2006 and 2007, and a decrease until 2017. In Lagoinha do Leste (Figure 7E), the regression model showed first an increase in the number of sampled faeces between 2004 and 2007, and a decrease until 2017. In Pântano do Sul (Figure 7F), the regression model showed first an increase in the number of sampled faeces between 2004 and 2005. A decrease was observed from 2005 to 2006, followed by an increase between 2006 and 2011, and finally decreased until 2017.
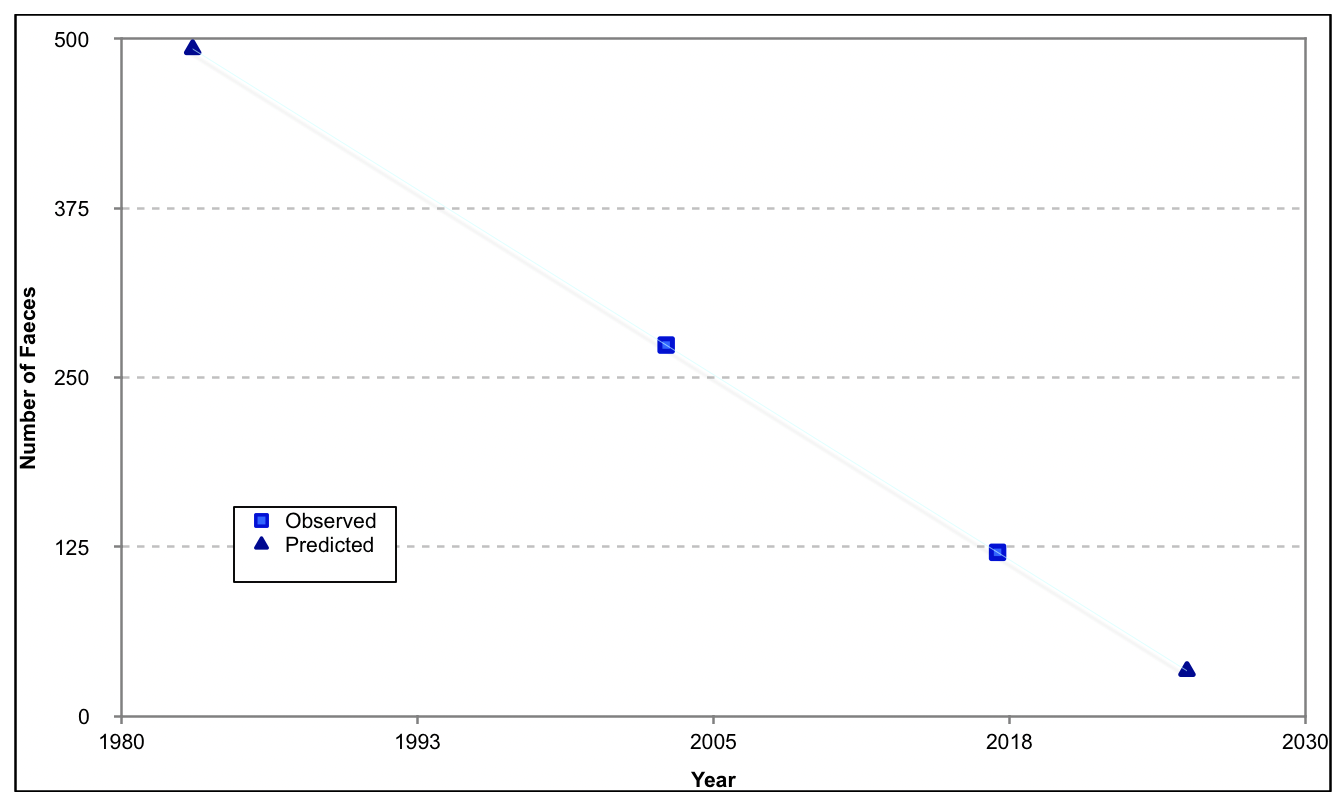
The linear model analysis considers a 14-year generation time. The number of faeces in the study area was estimated as 493 in 1983 and 34 in 2025, the triangle markers in Figure 8. It is assumed that the decline does not begin until 1983. As Figure 8 shows, the decline in the number of faeces does not happen before 2004.
DISCUSSION
The present study is based on direct observations, represented by the average variation in the number of faeces found over eight years (2003, 2004, 2005, 2006, 2007, 2008, 2009, and 2017), covering 14 years, or three otter generations. It does not present the size of the population but the intensity of the species’ presence in the monitored areas, a strategy used in several countries in Europe since the 1960s. The importance of this model is due to the difficulty of observing the otter in the wild, and the costs and logistics associated with DNA studies.
The large number of faeces, collected over a long period of time, made it possible to analyze the presence of otter subpopulations on Santa Catarina Island. The number of droppings varies among the different study sites. The Neotropical otter’s intensity of presence revealed that the favorite places for the species are Peri Lagoon and Conceição Lagoon.
Conceição Lagoon presented the highest number of otter faeces, followed by Peri Lagoon, but only between 2005 and 2009. In 2004, Peri Lagoon ranked first and Conceição Lagoon second. Naufragados, Lagoinha do Leste, and Saquinho always presented smaller numbers of otter faeces than in Conceição and Peri Lagoons, with the position changing over the years.
It is important to note that the otter showed a strong presence in marine waters such as Conceição Lagoon, Lagoinha do Leste, Naufragados, Saquinho, and Pântano do Sul. Carvalho Junior et al. (2012) demonstrated the otter’s presence in coastal islands along the coast of the state of Santa Catarina, Brazil.
Two statistical analyses were used. One was based on non-parametric tests associated with a polynomial regression model. According to the criteria and standards defined by the IUCN Standards and Petitions Subcommittee, the other follows a linear model. Both methods indicate a drastic reduction in the number of otters in the studied region. The results show that by 2030, the otter’s intensity on the Santa Catarina Island should reach an imperceptible average value.
The loss of habitat in the study area, the increasing extraction of water for human consumption, and the intense mass tourism gets worse every year. Consequently, an increase in the number of people is observed, as well as in the number of cars on highways that are built without protective measures for the passage of fauna.
As an example, Palhoça, a municipality neighboring Florianópolis, experienced a population increase of 60.52% from 2000 to 2017; today it occupies the tenth position among the most populous cities in the state of Santa Catarina, with 164,926 inhabitants, while Florianópolis occupies the second position, with 485,838 inhabitants (Will, 2020). A study on the projection of population growth for Conceição Lagoon, a key area for the Neotropical otter on Santa Catarina Island, shows that of the 62,596 people today, an increase of about 45% can be expected in 2040 (Machado, 2019). For a species like the Lontra longicaudis, organized in a metapopulation form, in constant movement from one ecosystem to another, this situation can produce their local extinction.
With the results obtained, the best scenario would be the category A1 (CR) (from IUCN 2001; 2012a; 2012b), which is still alarming. For that, it would be necessary to have concrete evidence that the impacts caused by the loss of suitable habitat, retaliation, and being run over on highways could be reversible. However, this does not seem to be the case.
Considering the probability that the environmental degradation will not cease but, on the contrary, get worse, the criterion to be adopted, according to the IUCN Red List, is the A2. Therefore, the average reduction in the number of otter droppings over the past 14 years, or three generations, suggests that the population is critically endangered (CR) in the area. We hope that this methodology can be applied to other areas of Brazil to know the status of the different populations of Neotropical otters.
Acknowledgements: We would like to acknowledge Marcelo Tosatti for helping with the fieldwork. Grateful to Caroline Cosnard for the statistical analysis on R Statistics.
REFERENCES
Bailey, M., Rochford J. (2006). Otter Survey of Ireland 2004/2005. National Parks and Wildlife Service, Department of Environment, Heritage and Local Government, Dublin.
Barbieri F., Machado R., Zappes C.A., Oliveira L.R. (2012). Interactions between the Neotropical otter (Lontra longicaudis) and gillnet fishery in the southern Brazilian coast. Ocean & Coastal Management 63: 16–23. https://doi.org/10.1016/j.ocecoaman.2012.03.007.
Campos, É.T. (2004). A gestão territorial urbana no município de Florianópolis: uma abordagem sobre a expansão imobiliária e seus impactos ambientais. (Dissertação de Mestrado). Universidade Federal de Santa Catarina, Florianópolis.
Carvalho Junior, O. (2007). No rastro da lontra brasileira. 1st ed. Bernúncia Editora, 103 pp.
Carvalho Junior, O., Birolo, A.B., Macedo-Soares, L. (2010). Ecological Aspects of Neotropical Otter (Lontra longicaudis) in Peri Lagoon, South Brazil. IUCN Otter Spec. Group Bull. 27: 105–115.
Carvalho Junior, O., Fillipini, A.; Salvador, C. (2012). Distribution of Neotropical otter, Lontra longicaudis (Olfers, 1818) (Mustelidae) in coastal islands of Santa Catarina, Southern Brazil. IUCN Otter Spec. Group Bull., 29(2): 95–108.
Carvalho Junior, O. (2016). Emergy Analysis of the Peri Lake System and the Role of the Neotropical Otter. IJRRAS 29: 31–54.
Carvalho Junior, O., Birolo, A.B. (2019). Projeto Lontra. Turismo de Conservação como Interface Social em Projetos de Pesquisa. 1st ed. Bambu, São Paulo, 160 pp.
Castro, F.R., Stutz-Reis, S., Reis, S.S., Nakano-Oliveira, E., Andriolo, A. (2014). Fishermen’s perception of Neotropical otters (Lontra longicaudis) and their attacks on artisanal fixed fence traps: The case of caiçara communities. Ocean & Coastal Management 92: 19–27.
Chanin, P. (2003a). Monitoring the Otter Lutra lutra. English Nature, Peterborough.
Chanin, P. (2003b). Ecology of the European Otter. Peterborough, Peterborough.
Chapman, P.J., Chapman, L.L. (1982). Otter Survey of Ireland 1980-81. The Vincent Wildlife Trust, London.
Chaves, T.F. (2016). Uma análise dos principais impactos ambientais verificados no estado de Santa Catarina. Revista Gestão & Sustentabilidade Ambiental 5: 611–634.
http://dx.doi.org/10.19177/rgsa.v5e22016611-634
Cianfrani, C., Guisan, A., Loy, A., Broennimann, O. (2018). More than range exposure: Global otter vulnerability to climate change. Biological Conservation. https://doi.org/10.1016/j.biocon.2018.02.031.
Colares, E.P., Waldemarin, H.F. (2000). Feeding of the Neotropical River otter (Lontra longicaudis) in the coastal region of the Rio Grande do Sul state, southern Brazil. IUCN Otter Spec. Group Bull. 17: 6–13.
Covello, C., Filho, N.O.H., Brilha, J. (2017). The Geodiversity of the Municipality of Florianópolis, Santa Catarina, Brazil: Values and Threats. Revista do Departamento de Geografia Universidade de São Paulo Volume Especial-Eixo 6, 104–111.
Erlinge, S. (1967). Home range of the otter Lutra lutra L. in Southern Sweden. Oikos 18: 186–209.
Gomez, J.J., Túnez, J.I., Fracassi, N., Cassini, M.H. (2014). Habitat suitability and anthropogenic correlates of Neotropical river otter (Lontra longicaudis) distribution. Journal of Mammalogy 95: 824–833. https://doi.org/10.1644/13-MAMM-A-265.
González, I., Utrera, A. (2001). Distribution of the Neotropical otter Lontra longicaudis in the Venezuelan Andes: habitat and status of its population. IUCN Otter Spec. Group Bull. 18: 86–92.
Green, R., Green, J. (1997). Otter Survey of Scotland 1991-1994. The Vincent Wildlife Trust, London.
Hamilton, G., Rochford, J. (2000). The Distribution of the Otter Lutra lutra in relation to Water Quality and other factors in three Hydrometric Areas in the East of Ireland. Heritage Council, Kilkenny.
IUCN. (2001). IUCN Red List Categories and Criteria: Version 3.1. IUCN Species Survival Commission. IUCN, Gland, Switzerland and Cambridge, U.K.
IUCN. (2012a). Guidelines for application of IUCN Red List Criteria at Regional Levels: Version 4.0. Gland, Switzerland and Cambridge, U.K. Available at https://www.iucnredlist.org/resources/categories-and-criteria.
IUCN. (2012b). IUCN Red List Categories and Criteria: Version 3.1. Second edition. Gland, Switzerland and Cambridge, U.K. Available at https://www.iucnredlist.org/resources/categories-and-criteria.
IUCN Standards and Petitions Committee. (2019). Guidelines for Using the IUCN Red List Categories and Criteria. Version 14. Prepared by the Standards and Petitions Committee. Downloadable from https://www.iucnredlist.org/resources/redlistguidelines
Lenton, E.J., Chanin, P.R.F., Jefferies, D.J. (1980). Otter Survey of England 1977-79. Nature Conservancy Council, London.
Machado, M.A. (2019). Avaliação da influência do crescimento populacional na balneabilidade da Conceição Lagoon, Florianópolis - SC (Trabalho Conclusão do Curso de Graduação em Engenharia Sanitária e Ambiental do Centro Tecnológico da Universidade Federal de Santa Catarina). Universidade Federal de Santa Catarina, Florianópolis.
Odum, H. T. (1996). Environmental accounting: Emergy and environmental decision making. New York: Wiley.
Pacifici, M., Santini, L., Marco, M.D., Baisero, D., Francucci, L., Marasini, G.G., Visconti, P., Rondinini, C. (2013). Generation length for mammals. Nature Conservation 5: 89–94. https://doi.org/10.3897/natureconservation.5.5734.
Reuther, C. (2000). Surveying and Monitoring Distribution and Population Trends of the Eurasian Otter (Lutra Lutra): Guidelines and Evaluation of the Standard Method for Surveys as Recommended by the European Section of the IUCN/SSC Otter Specialist Group. Gruppe Naturschutz, 148 pp.
Rodrigues, L.A., Leuchtenberger, C., Kasper, C.B., Carvalho Junior, O., Silva, V.F. (2013). Avaliação do risco de extinção da Lontra Neotropical Lontra longicaudis (Olfers, 1818) no Brasil. Biodiversidade Brasileira 3: 216–227.
SOS Mata Atlântica/INPE. (2018). Atlas dos Remanescentes Florestais da Mata Atlântica. Mapeamento dos Sistemas Costeiros. SOS Mata Atlântica/INPE, São Paulo.
Strachan, R., Jefferies, D.J. (1996). Otter Survey of England 1991- 1994: a Report on the Decline and Recovery of the Otter in England and on its Distribution, Status and Conservation in 1991- 1994. The Vincent Wildlife Trust, London.
Trinca, C.S., Waldemarin, H.F., Eizirik, E. (2007). Genetic diversity of the Neotropical otter (Lontra longicaudis Olfers, 1818) in Southern and Southeastern Brazil. Brazilian Journal of Biology 67: 813–818. https://doi.org/10.1590/S1519-69842007000500003.
Trinca, C.S., Thoisy, B., Rosas, F.C.W., Waldemarin, H.F., Koepfli, K.P., Vianna, J.A., Eizirik, E. (2012). Phylogeography and Demographic History of the Neotropical Otter (Lontra longicaudis). Journal of Heredity 103: 479–492. https://doi.org/10.1093/jhered/ess001.
Will, M. (2020). Transformações socioespaciais na região metropolitana de Florianópolis: o caso do município de Palhoça - SC (Dissertação de Mestrado). Universidade Federal de Santa Catarina, Florianópolis.
Résumé: Statut de Conservation de la Loutre à la Longue Queue Lontra longicaudis (Olfers, 1818) (Carnivores : Mustélidés) dans lL’Île de Santa Catarina
Les loutres à longue queue (Lontra longicaudis) sont des mammifères semi-aquatiques classés comme «quasi menacés» par l'Union Internationale pour la Conservation de la Nature (UICN), confrontés à diverses menaces pour leur survie, telles que la fragmentation de l'habitat, la pollution de l'eau, les conflits avec les pêcheurs ou les attaques par des chiens. Un total de 9.531 épreintes a été collectées mensuellement durant 9 ans, sur une période 14 ans, de 2003 à 2017, dans 6 aires d'étude différentes sur l'île de Santa Catarina, au Brésil. Nous avons appliqué une analyse de fréquence par tests statistiques non paramétriques et un modèle de régression polynomiale. Un modèle linéaire a également été utilisé suivant les critères et normes définis par l'UICN. Les deux méthodes concordaient, montrant une diminution significative du nombre d'épreintes de loutres à longue queue durant cette période. Parce que les modifications de l'environnement ont été constantes au cours des 14 dernières années, le critère à adopter, selon la Liste rouge de l'UICN, est A2. Par conséquent, la réduction moyenne du nombre d’épreintes de loutres au cours des 14 dernières années, ou trois générations, suggère que la population est en danger critique d'extinction (CR).
Revenez au dessus
Resumen: Status de Conservación de Lontra longicaudis (Olfers, 1818) (Carnivora: Mustelidae) en la Isla de Santa Catarina
Las Nutrias neotropicales (Lontra longicaudis) son mamíferos semi-acuáticos clasificados como “Casi amenazados” por la Unión Internacional para la Conservación de la Naturaleza (UICN), y enfrentan varias amenazas a su supervivencia, como fragmentación del hábitat, contaminación del agua, conflictos con pescadores, o ataques por perros. Colectamos un total de 9.531 fecas, en forma mensual durante nueve años, cubriendo 14 años, desde 2003 hasta 2017, en seis diferentes áreas de estudio en la Isla de Santa Catarina, Brasil. Aplicamos análisis de frecuencias a través de tests estadísticos no-paramétricos, y un modelo de regresión polinómica. También usamos un modelo lineal, siguiendo los criterios y estándares definidos por la UICN. Ambos métodos coincidieron en mostrar un descenso significativo en el número de fecas de Nutria Neotropical a lo largo de este período. Como las modificaciones del ambiente fueron constantes durante los últimos 14 años, el criterio a ser adoptado, de acuerdo a la Lista Roja de la UICN, es el A2. Por lo tanto, la reducción promedio en el número de deposiciones de nutria a lo largo de los últimos 14 años, ó tres generaciones, sugiere que la población está críticamente amenazada (CR).
Vuelva a la tapa
