IUCN/SSC Otter Specialist Group Bulletin

©IUCN/SCC Otter Specialist Group
Volume 38 Issue 4 (August 2021)
Citation: Harrop, J and Cuculescu-Santana, M. (2021). Feeding Strategies for Captive Asian Small-Clawed Otters (Aonyx cinereus, Illiger, 1815): What Works to reduce Repetitive Feeding Anticipatory Activity in the Cold Season? IUCN Otter Spec. Group Bull. 38 (4): 228 - 248
Feeding Strategies for Captive Asian Small-Clawed Otters (Aonyx cinereus, Illiger, 1815): What Works to reduce Repetitive Feeding Anticipatory Activity in the Cold Season?
Jacob Harrop 1* and Mirela Cuculescu-Santana1*
1Department of Applied Sciences, Faculty of Health and Life Sciences, Northumbria University, Newcastle upon Tyne, NE1 8ST, UK
*Corresponding Author: mirela.cuculescu@northumbria.ac.uk
(Received 20th August 2020, accepted 1st April 2021)
Download PDF (1.6 MB)
Supplementary Material (404 KB)
Abstract: This case-study analysed the behaviour and enclosure use of a pair of Asian small-clawed otters to investigate the impact of changes in feeding strategy on repetitive behaviours associated with feeding anticipation, in the context of the influence of seasonal changes in temperature on these tropical mammals.
The otters displayed less swimming and resting, less sleeping and more begging, vocalisations and overall vigilance in winter compared to summer, suggesting more hunger due to increased energetic demands for thermoregulation.
The introduction of an additional mid-morning feed in winter without increasing the total amount of food per day was only partly effective on the targeted behaviours. The overall vigilance displays and vocalisations increased significantly, resting and sleeping decreased, but begging did not change compared to previous winter and summer values. Begging before the feed at 14:00 hours was less frequent, suggesting less hunger at this time, but increased to higher values later in the afternoon.
An increase in the total amount of food per day from 20% to 30% of otter body weight in January 2019, with return to 3 feeds/day, was more effective at reducing the targeted behaviours. There were decreases in overall vigilance displays and in the frequencies of begging and short calls and increases in play behaviours, social affiliative interactions and resting and sleeping, suggesting a reduction in levels of hunger and related stress.
This study emphasized the importance of considering how local climate affects enclosure conditions when assessing the nutritional, enrichment and climatisation needs of Asian small-clawed otters.
Keywords: Abnormal repetitive behaviours, activity patterns, seasonal differences, thermoregulation
INTRODUCTION
Captive Asian small-clawed otters (ASCO) represent important potential genetic reserves and resources for research into otter biology (Bateman et al., 2009). Aonyx cinereus (Illiger, 1815) has had ‘vulnerable’ status on the IUCN Red List since 2008 due to rapid population decline and loss of genetic variation, caused by habitat destruction, water pollution, decline in suitable prey and direct exploitation by humans (Wright et al., 2015). It has been recently moved from CITES Appendix II to Appendix I (CITES, 2019), due to an increase in illegal trade, linked to increased popularity as pets on social media (Kitade and Naruse, 2018; Harrington et al., 2019). The species still has an extensive distribution range in the tropics, from southern and south-eastern India and mainland Asia, through to Indonesia, Taiwan and Philippines, in diverse habitats, including coastal and freshwater wetlands, and rivers and lakes in forested areas (Wright et al., 2015). These wetland habitats are predicted to shrink by 17-41% by 2050 due to loss of suitable climatic areas (Cianfrani et al., 2018), emphasizing the need for both in situ and ex situ conservation efforts for the survival of the species.
ASCO have high display value in zoos and aquaria due to their playful and inquisitive nature and relatively high levels of activity during the day (Foster-Turley and Markowitz, 1982). The same features, based on innate foraging behaviours (Larivière, 2003; Kruuk, 2006) and high cognitive abilities (Perdue et al, 2011; Perdue et al., 2013; Ladds et al, 2017; Schmelz et al., 2017; Manns et al., 2018), make them prone to becoming bored in captivity and displaying high frequencies of abnormal repetitive behaviours (ARBs) such as pattern locomotion, repetitive up-down movements (begging), door banging, hair plucking, aggression and/or excessive vocalization, which are common in otters at many establishments (Morabito and Bashaw, 2012) and may lead to poor health, poor reproductive success and low welfare (Mason, 2010).
Various types of environmental enrichment are used in many zoos and aquaria to provide more stimulating captive conditions and improve otter welfare (AZA, 2009; Bishop et al., 2013), but there are very few quantitative studies evaluating enrichment effectiveness. Most of these focus on the effect of feeding enrichment on stimulating foraging and reducing ARBs in ASCO (Foster-Turley and Markowitz, 1982; Hawke et al., 2000; Ross, 2002; Gothard, 2007), as in the wild they spend up to 40-60% of their time foraging (Heap et al., 2008). The frequency of ARBs usually peaks as feeding anticipatory activity (FAA) (Hawke et al., 2000; Ross, 2002) and there is evidence to suggest this is mainly due to hunger rather than boredom (Gothard, 2007), especially in the cold season (Cuculescu-Santana et al., 2017). The lower end of the thermoneutral zone for ASCO is estimated at around 16°C (Borgwardt and Culik, 1999) and ambient temperatures below this value present additional thermoregulatory challenges for ASCO as tropical mammals (Kruuk, 2006). The husbandry guidelines for ASCO recommend temperatures of 22.2-24.4 °C for air and 18.3-29.4 °C for water (Heap et al., 2008) but in many zoos in the temperate regions they appear to cope well in both indoor and outdoor enclosures with limited climatisation (Reed-Smith and Polechla, 2002; Dornbusch and Greven, 2009; AZA, 2009).
Seasonal variations in temperature influenced the activity budgets of captive ASCO in both indoor and outdoor enclosures, with more time spent swimming and less feeding anticipatory activity (FAA), foraging and resting in summer compared to winter (Cuculescu-Santana et al., 2017; 2021), showing that the otters adjusted their behaviour to reduce heat loss and compensate for the increased energetic demand for thermoregulation in winter, but also displayed increased ARBs. ASCO have a significantly higher metabolic rate in cold water compared to other otter species, possibly due to poorer insulative capacity of the fur and skin (Borgwardt and Culik, 1999), which makes them lose heat over the whole body, similar to another tropical species, the giant otter Pteronura brasiliensis, and in contrast to the better cold-adapted Eurasian otter Lutra lutra (Kuhn, 2009; Kuhn and Meyer, 2009). While providing more food in the cold season may seem like an easy solution, the nutrition guidelines for ASCO recommend caution (Henry et al., 2012), because an increase in the amount of food given, combined with the often seen reduced levels of activity due to the colder temperatures, may lead to otters becoming overweight and developing other health problems (AZA, 2009).
This case-study describes the combined influence of seasonal changes in temperature and of a series of changes in feeding strategies aimed at reducing the ARBs associated with FAA on the behaviour of ASCO at the Tynemouth Aquarium, England (55°N latitude; temperate climate). The otters were expected to be more active in the summer with more time spent swimming and playing and less FAA and to display a day-time activity pattern strongly influenced by feeding times, with peaks in locomotion, begging and vocalisations before feeds (FAA), as shown in an earlier study at the same establishment (Cuculescu-Santana et al., 2017). Splitting the same amount of daily food (20% of body weight) between four feeds instead of three in autumn 2018 was expected to reduce FAA by avoiding longer periods with no feeding (Gothard, 2007; Cuculescu-Santana et al., 2021). In January 2019, the additional feed was stopped and the daily amount was increased to 30% of body weight, expecting this to be more effective at reducing FAA (Gothard, 2007). The study was carried out in collaboration with staff at Tynemouth Aquarium as part of their on-going enrichment plans, up to the time when the otters were moved to another establishment with an outdoor area in April 2019.
MATERIAL AND METHODS
Otters, Enclosure and Enrichment
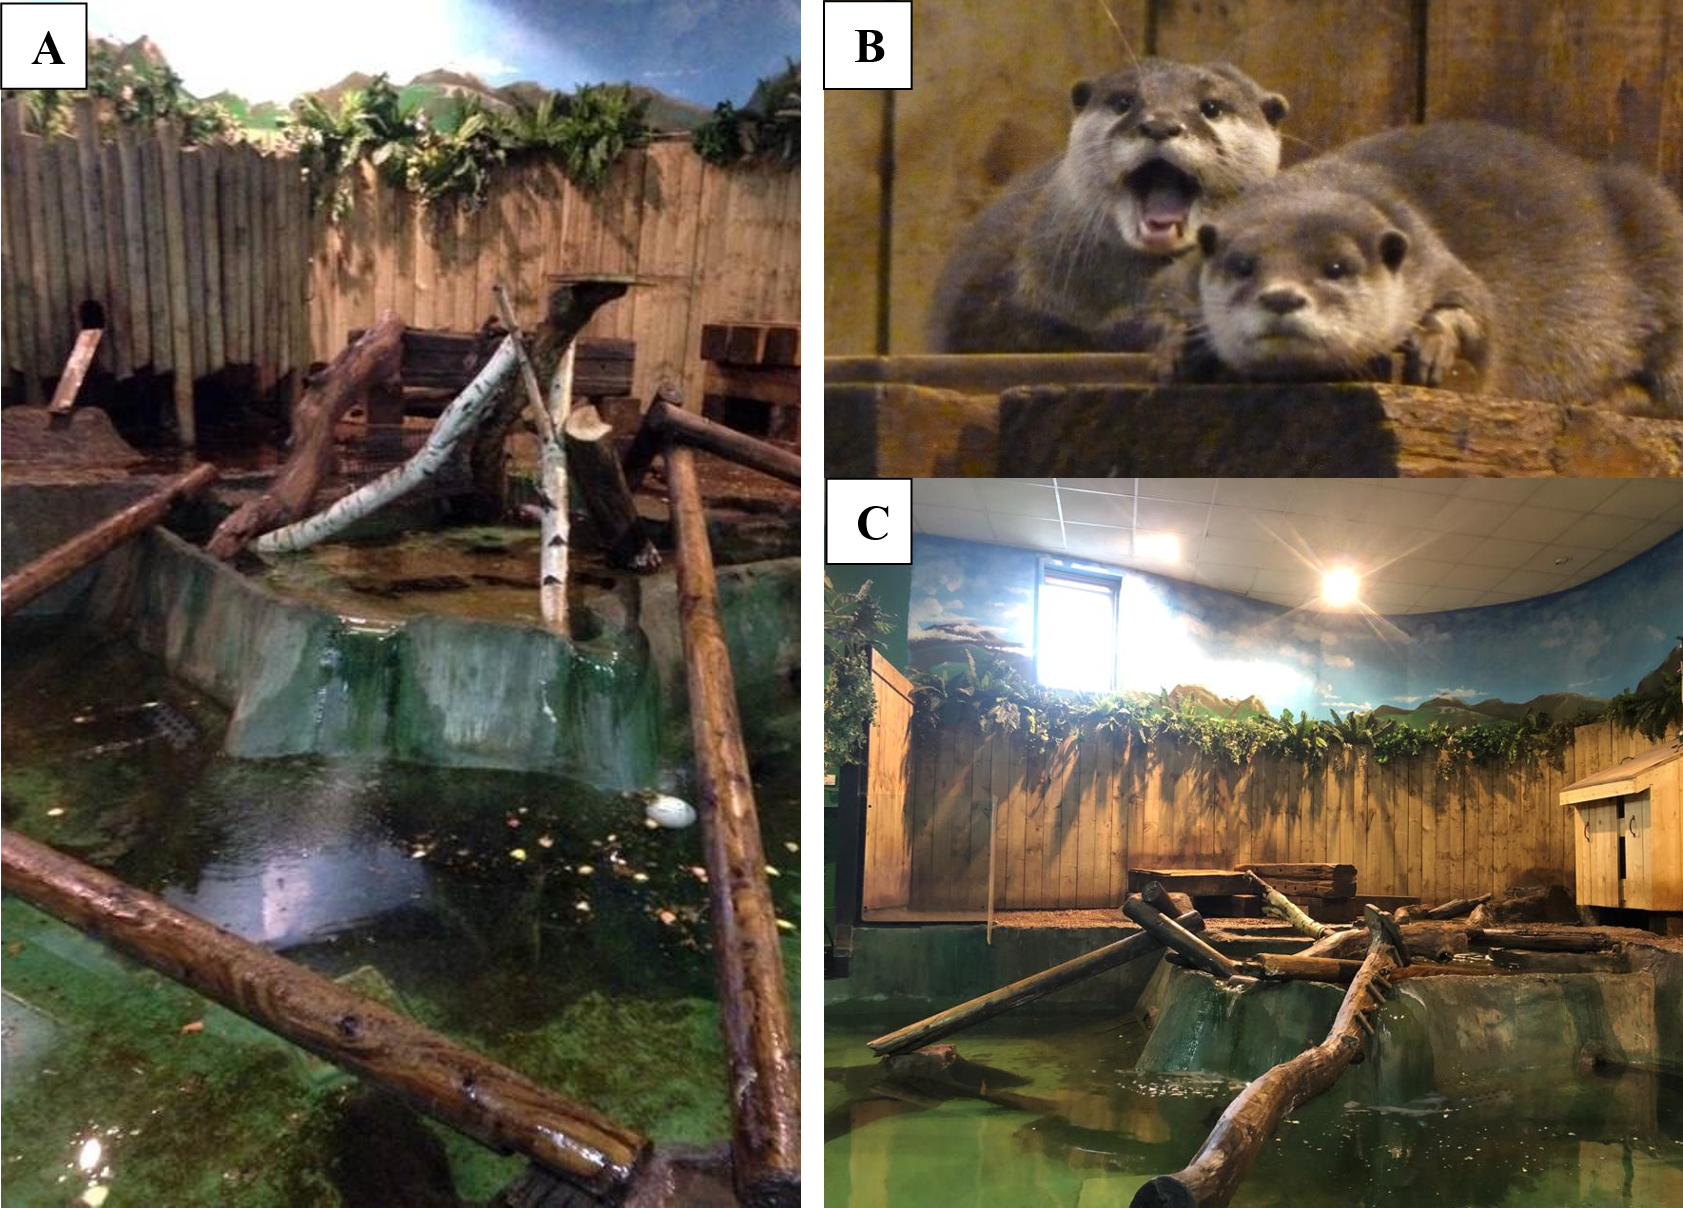
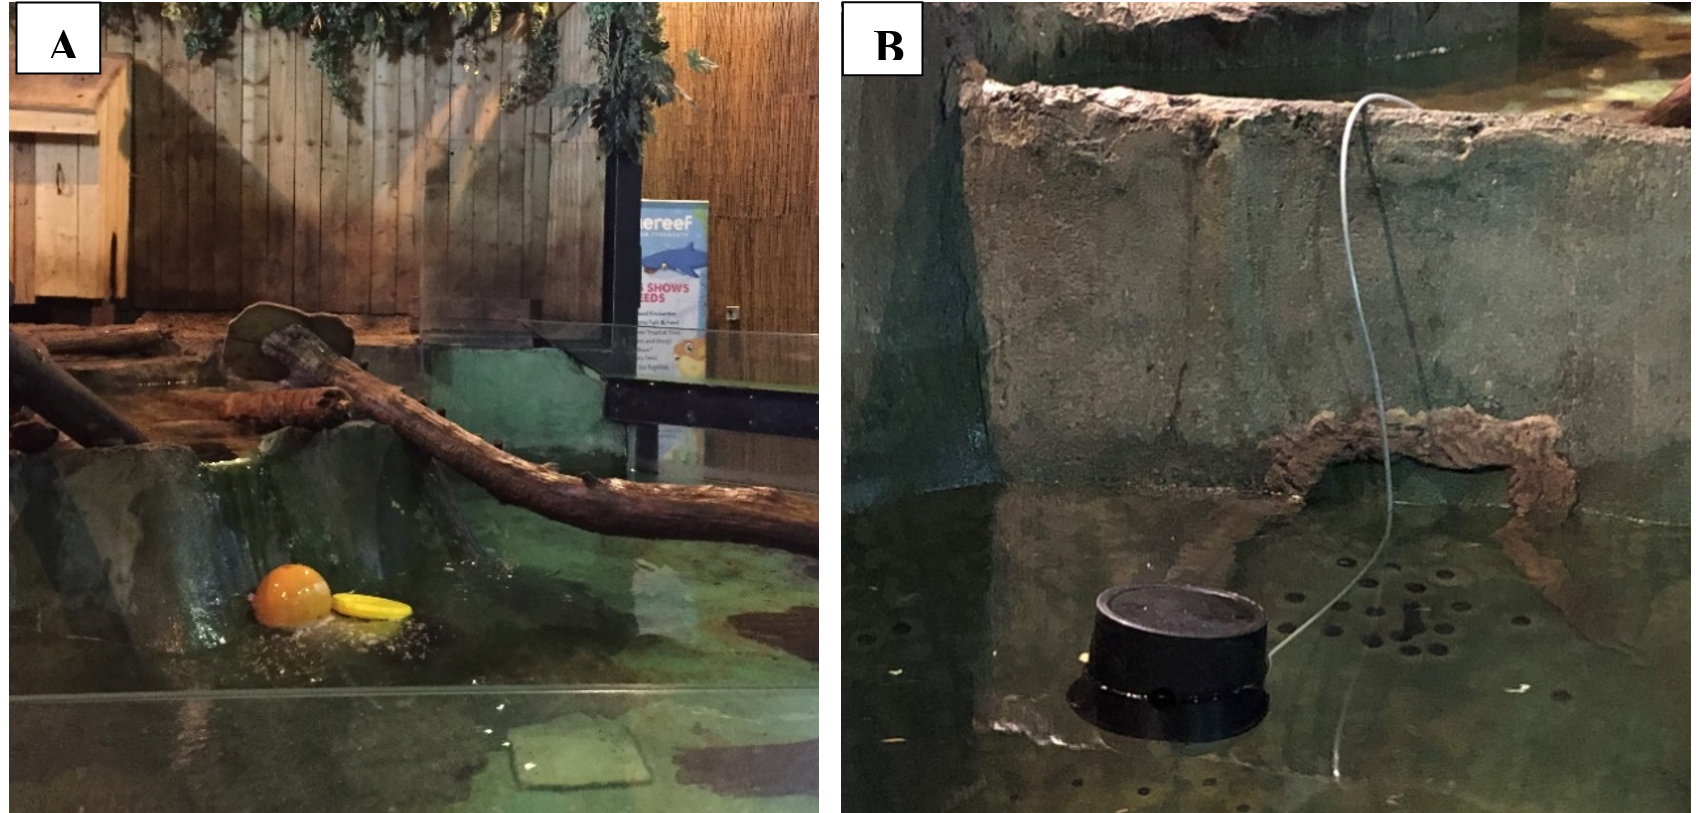
During the study period (November 2015 – March 2019) the Tynemouth Aquarium (TAQ) housed a pair of Asian small-clawed otters: a male born there in November 2005 (Gizmo), and a female born at Chester Zoo in October 2011 (Indra), who arrived at the TAQ in summer 2014 to replace Gizmo’s male sibling. Both otters were around 3 kg in weight and were housed in an indoor enclosure of approximately 100m2 surface area, 3:2 land to water ratio, with various structural enrichments (Figure 1). The otters were fed on a diet of fish, day-old chicks and red meat, along with smaller random scatter feeds (monkey nuts, chopped carrot and apples, crustacean claws, molluscs, mealworms). The feeding schedule, amount of food relative to otter body weight and the feeding enrichment strategies implemented during the study period are summarised in Table 1. Examples of containers used for food presentation are shown in Figure 2.
| Table 1: Feeding schedules and the main feeding enrichment strategies used at the Tynemouth Aquarium between November 2015 and March 2019, around and during the times when the data presented in this study were collected. | |
| Time of Implementation | Feeding Strategy |
|
November 2015 – September 20181 3 feeds 20% of body weight (~600g/day) |
9:00 am and 4:30 pm: food scattered around the enclosure, on dry areas or in the water, or hidden inside holes in the wooden structures; 2:00 pm: food usually placed inside a puzzle-box (plastic container with small holes on the sides, filled either with criss-crossing elastic cords, pine cones, or soft spiky coloured balls) lowered into the water, from the outside of the enclosure; public talk delivered by a keeper located outside the enclosure |
|
October 2018 – early January 2019 4 feeds 20% of body weight (~600g/day) |
9:00 am and 4:30 pm: food scattered around the enclosure, as above; 11:30 am: extra feed, food scattered around the enclosure, as above; keeper inside the enclosure on days when the feed was combined with training; 2:00 pm: food scattered all around the enclosure, or placed inside a puzzle-box (as above) placed either on dry areas or into the water; public talk delivered by a keeper located outside the enclosure |
|
January – March 2019 3 feeds 30% of body weight (~900g/day) |
9:00 am and 4:30 pm: food scattered around the enclosure, as above; 2:00 pm: food scattered all around the enclosure, or placed inside a puzzle-box (as above) placed either on dry areas or into the water; public talk delivered by a keeper located outside the enclosure; |
| 1Various other forms of food presentation were used between November 2015 and September 2018, within the same schedule, for shorter periods of time (eg. meat and vegetable kebabs, vine balls, closed containers with lids that the otters had to open, mealworms scattered inside boxes with straw or soil, kong balls, ice pops in the summer, etc.). | |
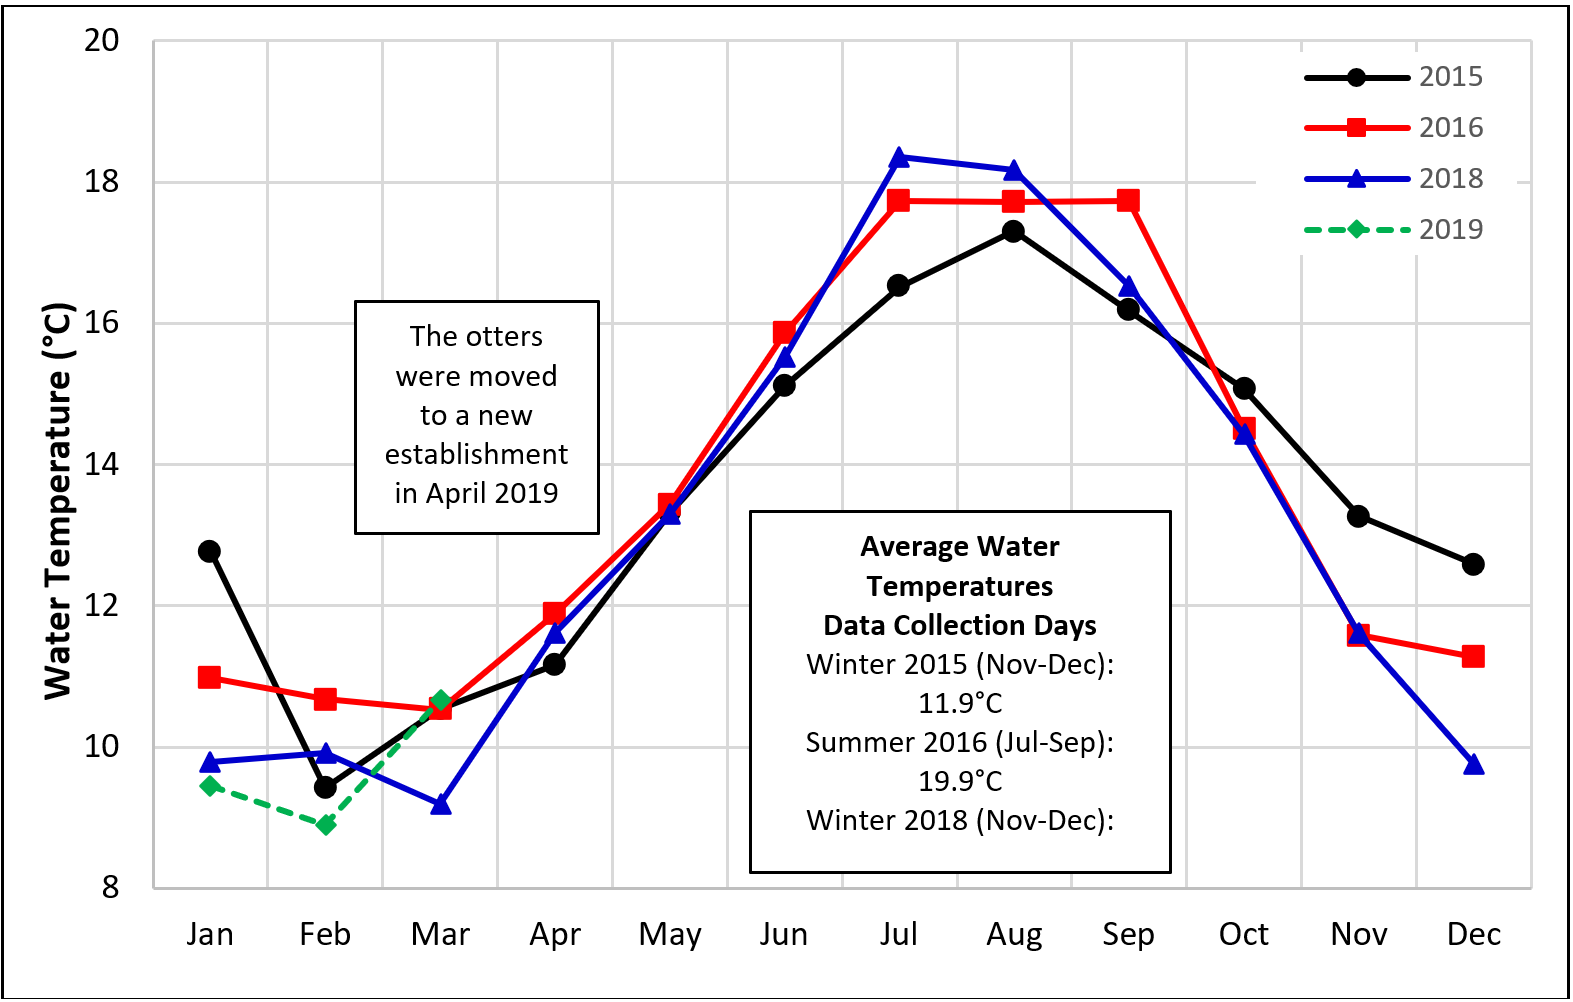
The enclosure area was not climate-controlled, apart from a heat lamp above the otters’ preferred sleeping area and the ambient temperature varied in correlation with the outdoor fluctuations. The pool water temperatures varied between 13.8-19.8 °C in summer and 4.4-16.6 °C in winter months (Figure 3 insert). Natural light entered only through a small window. Artificial light was provided 8:00am-6:00pm (10 hours light:14 hours dark; metal halide bulbs with UVB qualities).
Data Collection
Data were collected on four random days in November-December 2015 (winter 2015), July-September 2016 (summer 2016) and November-December 2018 (winter 2018) and on three random days in January-March 2019 (winter 2019), by two observers (0.977 inter-observer correlation coefficient; Rees, 2015), using the same methods as an earlier study (Cuculescu-Santana et al., 2017). Six 20-minutes observation periods per day were completed in winter 2015, around the second feed and between the second and the third feed (the Aquarium closed to the public before the third feed). Twelve 20-minutes observation periods per day were completed in summer 2016, winter 2018 and winter 2019, to include the morning and midday period, as well as five of the six time intervals from 2015 (in winter 2018-19 the Aquarium closed to the public at 4:00pm, preventing full overlap of data collection times between seasons). The average pool water temperatures for the days of data collection are shown in Figure 3, alongside the average monthly temperatures for the whole study period.
Focal instantaneous time sampling every 15 seconds was used for the state behaviours of the male only (Table 2) and scan every 60 seconds for the location in the enclosure of both otters (Table 3) (Martin and Bateson, 2007). Only the male was used as the focal animal for consistency of monitoring the time spent in the water in different seasons, as he tended to swim more than the female (Janusz, 2017), and for comparison with earlier observations from summer and winter 2013 (Cuculescu-Santana et al., 2017). The event behaviours (Table 2) were recorded for both otters using the continuous scan method with one-zero rule for each 1-minute interval of observation time (Rees, 2015). The approximate visitor numbers were recorded for each 1-minute interval using a ranked score from 1 to 5 (1=a few; 2=several; 3=many; 4=full room; 5=crowded room).
| Table 2: Otter ethogram. State behaviours and event behaviours (Cuculescu-Santana et al., 2017). | |
| State Behaviours | Description of Behaviour |
| Swimming | Locomotion in deep or shallow water, with the head out or under water, including diving and foraging in water |
| Land Locomotion | Walking, climbing or running on the ground or on other dry structures in the enclosure (with the head up) |
| Foraging | Locomotion on land with the head down and the nose close to the ground, interpreted as searching for food |
| Scent Marking | Rubbing a body part against the ground, a structure or a wall (while stationary at that location) |
| Aggression | Fighting or aggressive displays towards another otter |
| Maintenance | Eating (biting and chewing food), drinking and self-grooming (using paws or mouth to clean, dry or smooth fur; scratching) |
| Playing | Non-aggressive playful interaction with another otter or another object, e.g. pebble, plastic toy, enrichment object |
| Vigilance | Being alert and looking around while stationary, on four limbs, lying down with head up, or standing (vigilance standing or ‘begging’ displays) |
| Social Affiliative | Rubbing body against the body of another otter; rolling around with another otter in or out of water; sexual behaviour; social grooming (using paws or mouth to clean, dry or smooth the fur of another otter) |
| Resting & Sleeping | Lying down with head down and eyes open or closed; occasionally looking around when a noise occurs. |
| Out of Sight | Inside the den, or behind a structure, so that the observer cannot see what the otter is doing. |
| Event Behaviours | Description of Behaviour |
| Begging | Standing on rear paws or doing repetitive up-down movements, with forepaws held in front |
| Short Calls | Short loud ‘squeaky’ sounds |
| Long Squeals | Longer and higher pitched sounds |
Data Processing and Data Analysis
State behaviour data were converted into times spent engaged in each behaviour, during each observation period, and used to produce average behavioural budgets and day-time patterns of activity for each season (presented as % of observation time). The event behaviour data were processed as frequency of 1-minute intervals during which they occurred per observation period (presented as % of total number of 1-minute intervals per season or per time of day/season). The frequency and length of swimming bouts were estimated by counting the total number of 1-minute intervals during which swimming was recorded 4, 3, 2, 1 or 0 times for each season. Location data were processed as frequency of occurrence at each location per observation period (presented as % of total number of locations recorded per season or per time of day/season). Visitor data were processed as average scores per observation period, time of day and season. Kruskal-Wallis tests for the influence of season and time of day on otter behaviour and enclosure use were carried out in SPSS V26 at level of significance P<0.05, using the actual time and frequency values. The tests for the influence of season were carried out using only the data sets for the times of day when data were collected in all four seasons included in this study. The two-way chi square test (Microsoft Excel) was used to test for the influence of season on the frequency of occurrence of 1-minute intervals with swimming recorded 4, 3, 2, 1 or 0 times.
Ethical Considerations
The project received ethical approval from the Ethics Commission of Northumbria University and was carried out with consent from and in collaboration with the Displays Manager and the Keepers at the TAQ. The data were collected from outside the enclosure without any direct interaction between observers and otters.
RESULTS
Seasonal Differences under Standard Feeding Strategy – Winter 2015 and Summer 2016
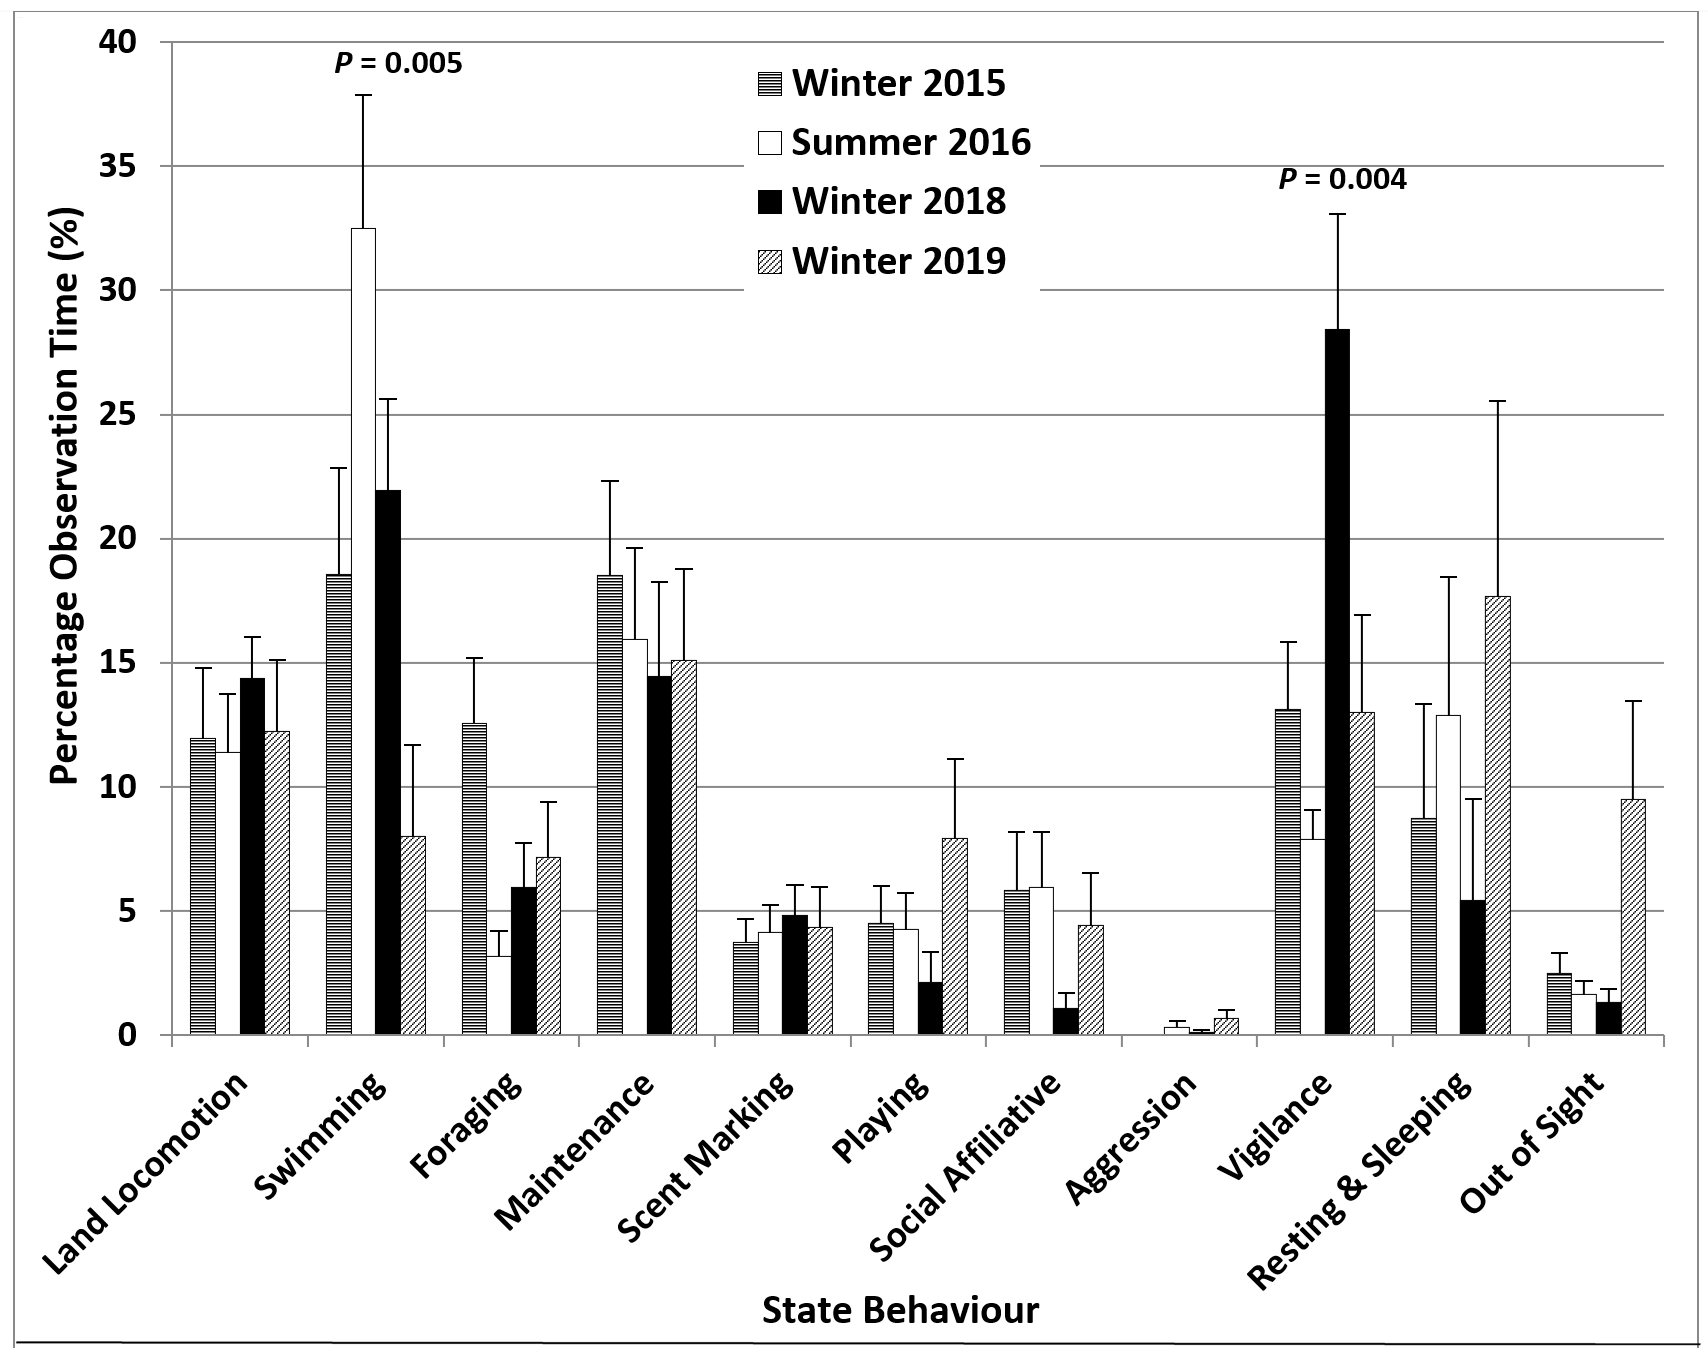
Under standard feeding strategy conditions (3 feeds a day; 20% wt/body wt), the male otter at the Tynemouth Aquarium (TAQ) spent significantly more time swimming in summer 2016 compared to winter 2015 (32.5% > 18.6%), less time foraging on land (3.2% < 12.6%), significantly less time displaying vigilance (7.9% < 13.9%) and more time resting and sleeping (12.9% > 8.8%) (Figure 4). The values for aggression were low in both seasons (0-0.3%). In summer 2016, the relative frequency of continuous swimming bouts was significantly higher than expected if no seasonal influence was assumed, while that of 1-minute intervals with no swimming was significantly lower, with the opposite applying to winter 2015 (Table 4).
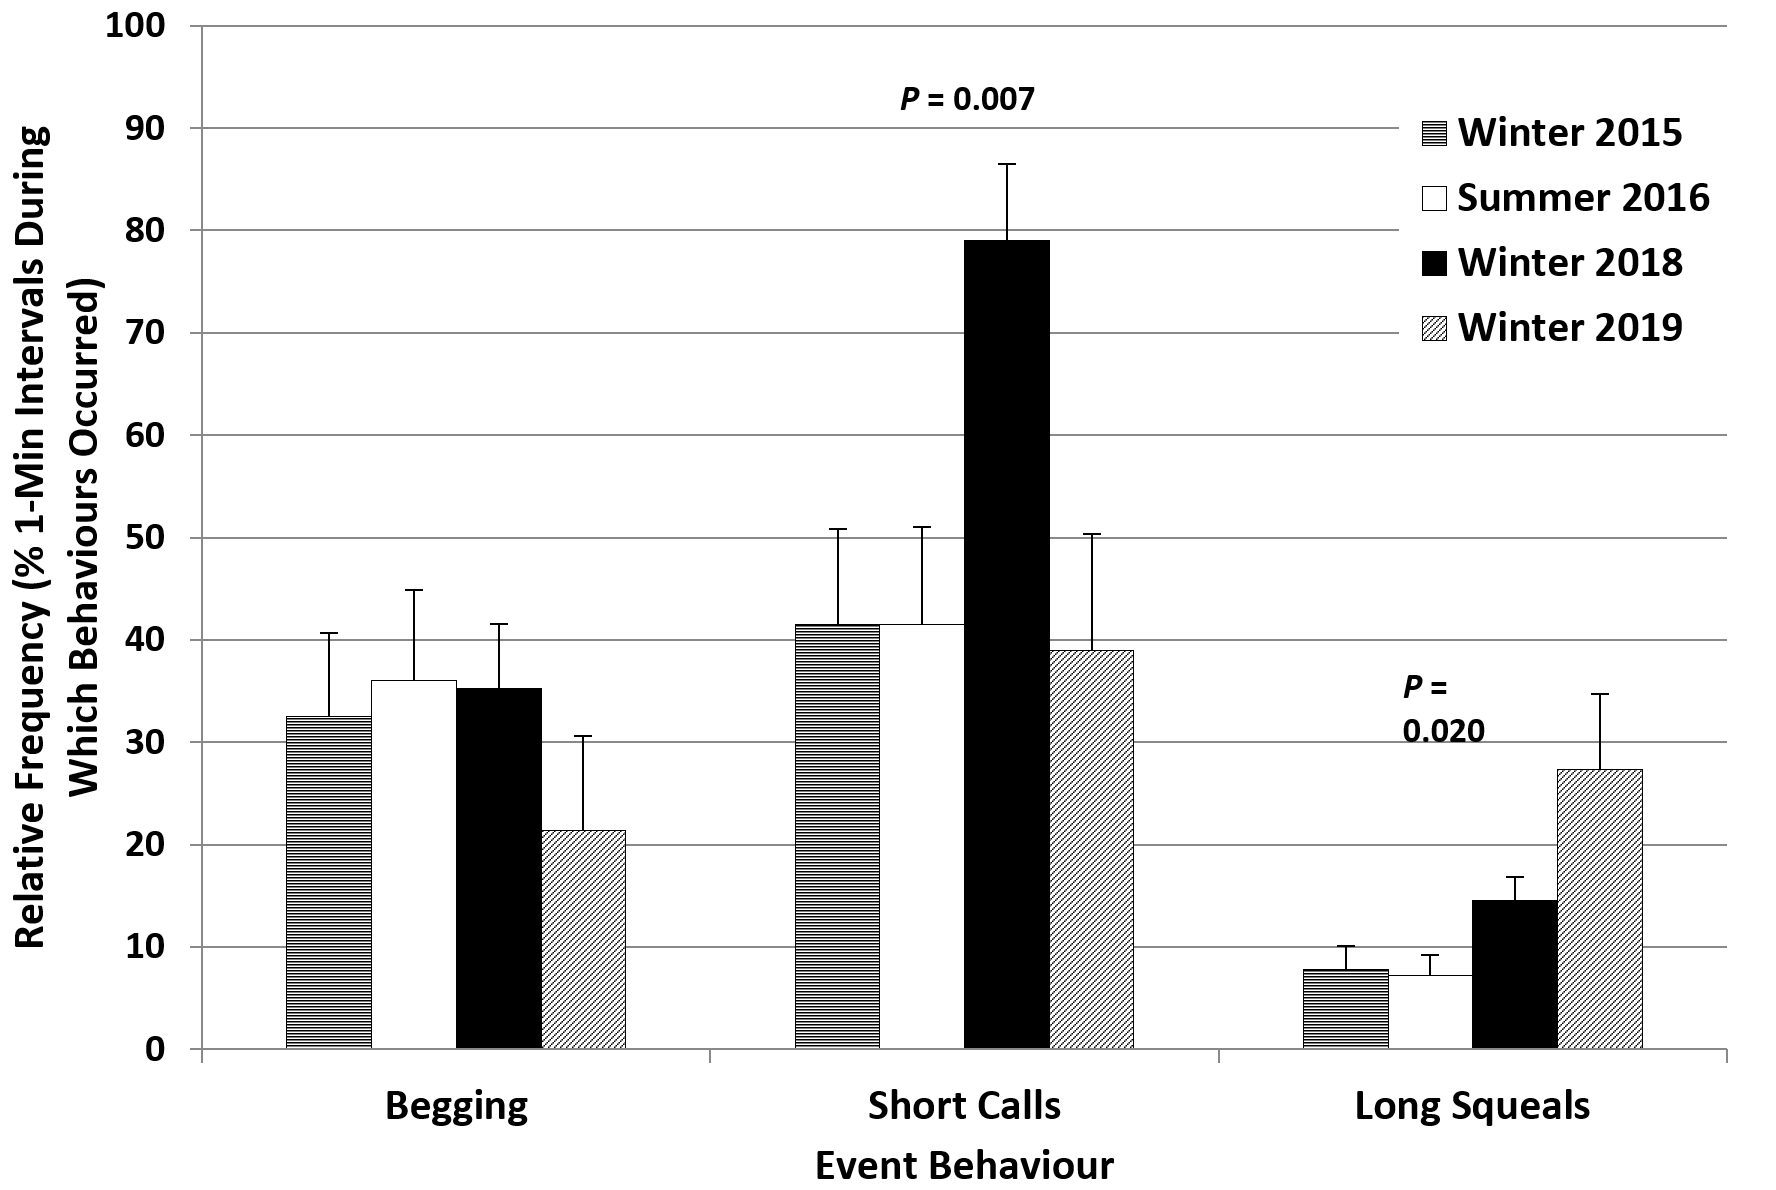
There were no differences between the summer 2016 and winter 2015 frequencies of repetitive event behaviours, with relatively high values for begging (32.5-36%) and short calls (41.5%), and low values for long squeals (7.3-7.8%) in both seasons (Figure 5).
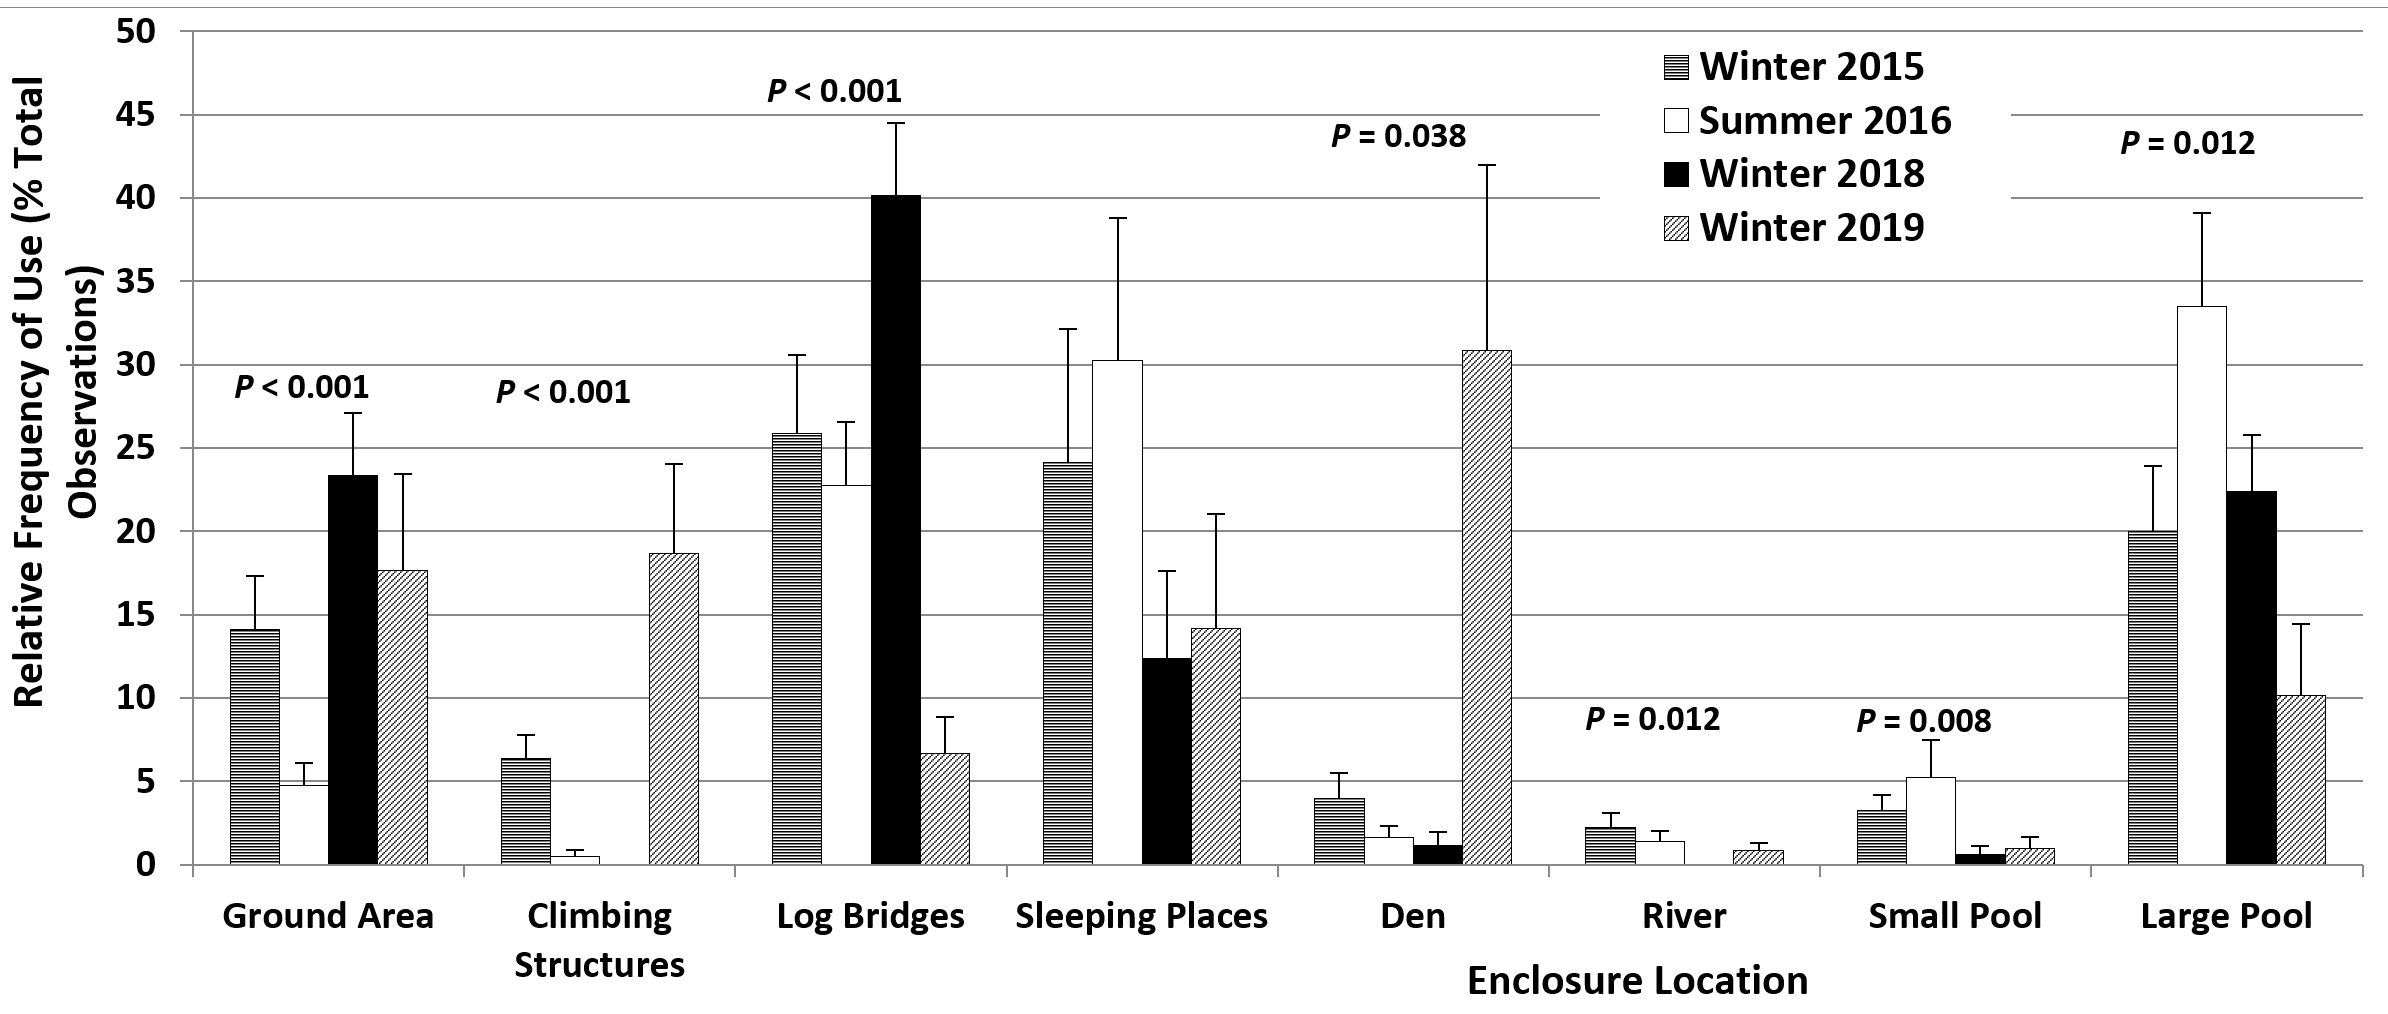
The seasonal differences in enclosure use (Figure 6) reflected the differences described for state behaviours. The large pool and the small pool were used significantly more frequently in summer 2016 than in winter 2015 (33.5% > 20% and 5.3% > 3.3%, respectively). The sleeping places were also used more frequently in summer 2016 (30.3% > 24.1%). In contrast, the climbing structures (6.4% > 0.5%) and the ground areas (14.1% > 4.8%) were used significantly more frequently in winter 2015 than in summer 2016.
The Influence of the Changes in Feeding Strategies
The introduction of an additional mid-morning feed in winter 2018 (4 feeds/day; 20% wt/body wt), aimed at reducing repetitive behaviours, appeared to have the opposite effect. The time spent displaying vigilance increased significantly to 28.4%, more than double the value for winter 2015, with decreases in foraging on land (5.9% < 12.6%), resting and sleeping (5.4% < 8.8%), playing (2.1% < 4.5%), affiliative social interaction (1.1% < 5.8%) and maintenance (14.4% < 18.5%) (Figure 4). Slightly more time was spent swimming in winter 2018 (21.9%) and the frequency of continuous swimming bouts up to 30-45 seconds (swimming recorded 3-4 times in the same 1-minute interval) was also higher than in winter 2015 (Table 4). For event behaviours, only the relative frequencies of short calls and long squeals increased significantly, to 79% and 14.5%, respectively, almost double the corresponding values for winter 2015. The value for begging was very close to those for the previous seasons (Figure 5).
The increase in the daily amount of food to 30% wt/body wt in January 2019 and the removal of the fourth feed were associated with a significant decrease in the percentage of time spent engaged in vigilance and swimming, to 13% and 8%, respectively, to around half the values for winter 2018. Compared to winter 2018, there were relatively large increases in the time spent resting and sleeping (17.7% > 5.4%) and out of sight (9.5% > 1.3%), as well as in time spent playing (7.9% > 2.1%) and in affiliative social interaction (4.4% > 1.1%) (Figure 4). The relative frequency of 1-minute intervals with no swimming was 84%, higher than in all previous seasons (Table 4).
The changes in the relative frequencies of event behaviours were also mostly in the desired direction. The values for short calls (39%) and begging (21.3%) decreased compared to winter 2018 (79% short calls, 35.3% begging; Figure 5), while the frequency of long squeals increased (27.3% > 14.5%).
The differences in enclosure use relative to winter 2015 were consistent with the differences in behaviour. The log bridges where vigilance was usually displayed and the ground areas were used significantly more frequently in winter 2018 (40.1% > 25.9% and 23.4% > 14.1%, respectively), with less frequent use of the sleeping places (12.4% < 24.1%) and the den (1.1% < 4%) and no use of the climbing structures (Figure 6). In winter 2019 there were significant increases in the frequency of use of the den (30.8% > 4%), where the heat lamp had been relocated to, and of the climbing structures (18.7% > 6.4%). Areas used significantly less frequently compared to winter 2015 were the log bridges (6.7% < 25.9%) and the large (10.2% < 20%) and small pools (1% < 3.3%). The former sleeping places were also used less frequently (14.2% < 24.1%) (Figure 6).
Day-Time Activity Patterns and Variation in Visitor Numbers in Different Seasons
Figures 7-11 present the influence of time of day on otter behaviour, using all the data collected in the four seasons included in this study. The values used to produce Figures 7-11 and the outcomes of the statistical analysis for the influence of time of day on state and event behaviours are available as Supplementary Materials.
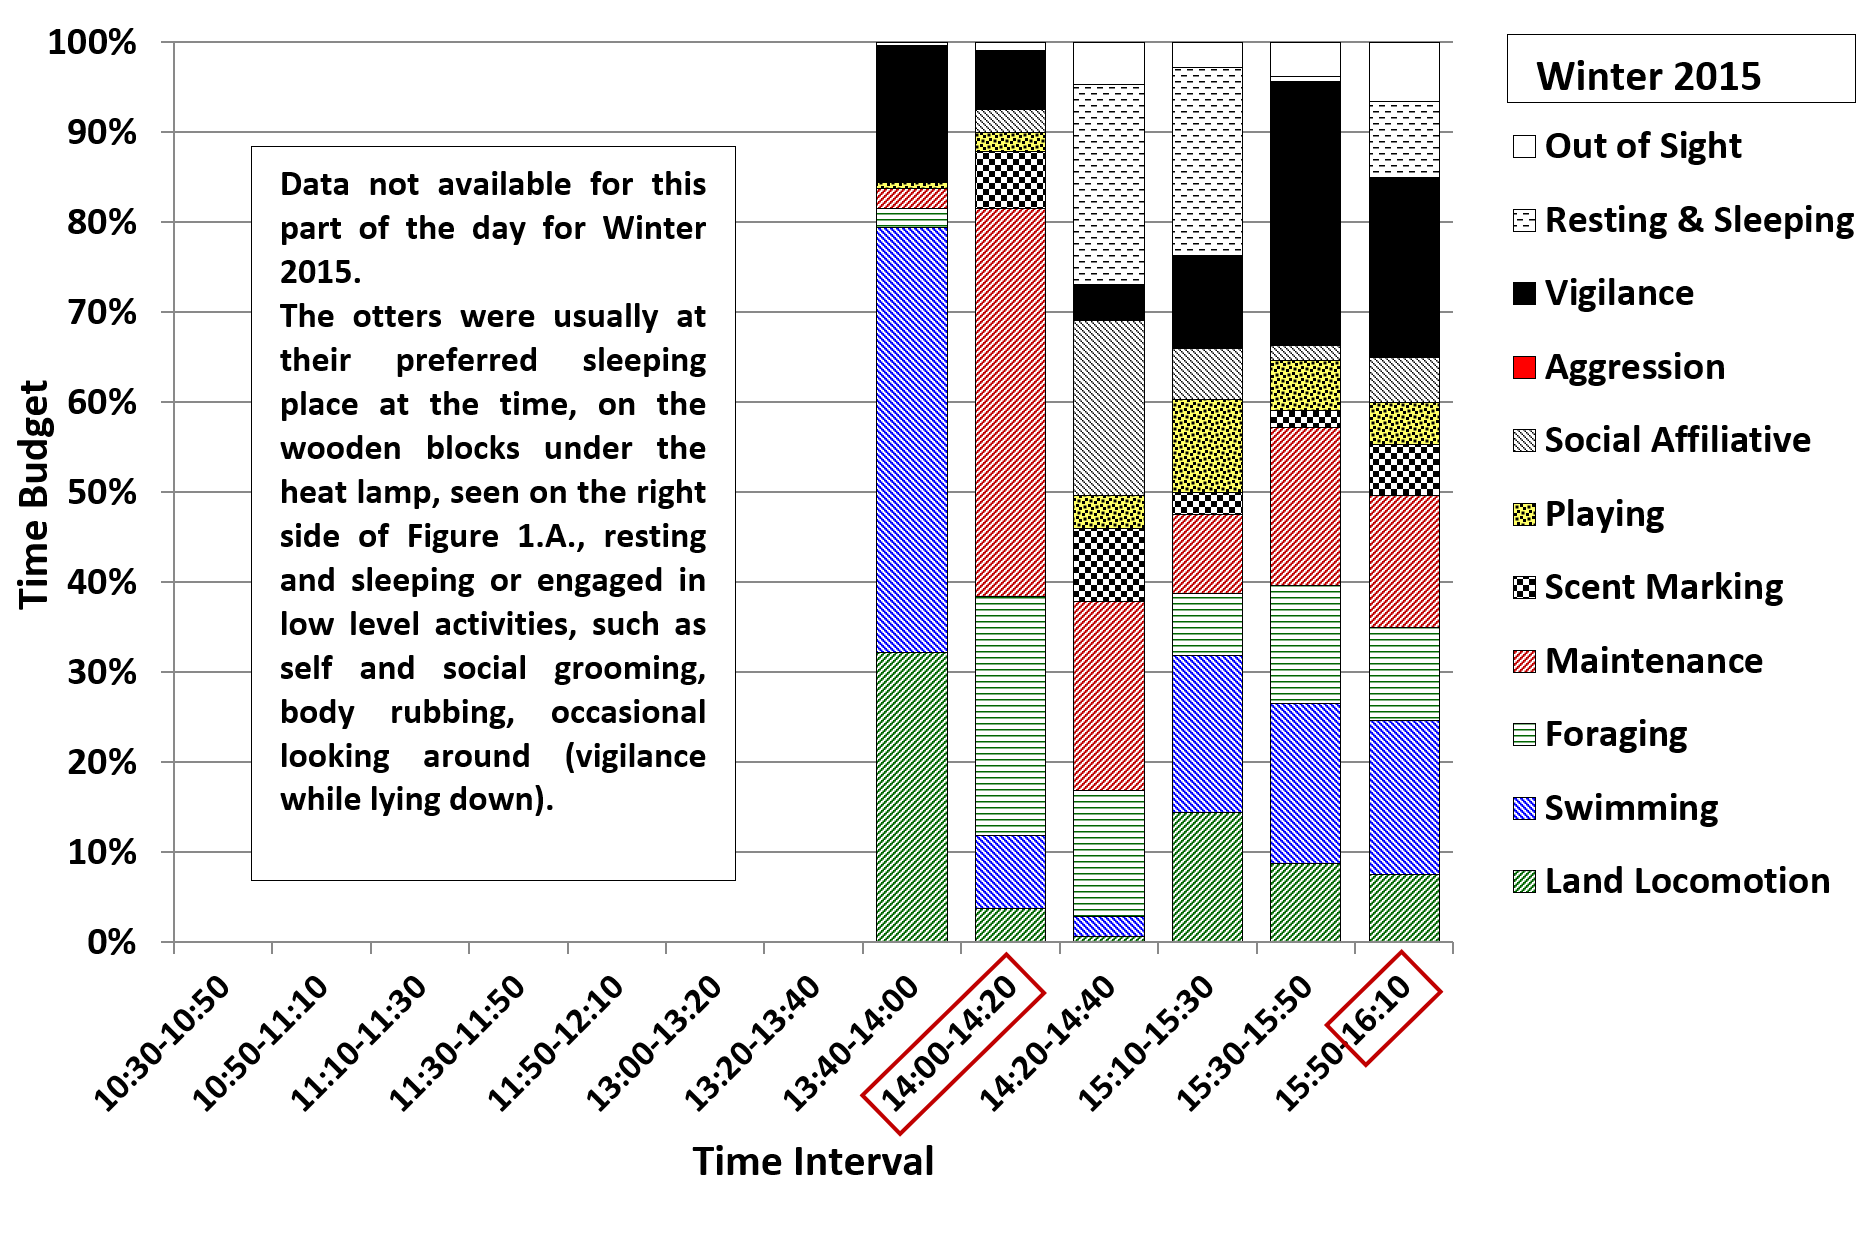
In winter 2015 (Figure 7; standard feeding strategy) there were peaks in land locomotion, swimming and vigilance during the 13:40-14:00 interval before the second feed of the day, with another peak in vigilance during the 15:30-15:50 interval. During feeding (14:00-14:20), there were peaks in foraging and maintenance (mostly eating and drinking) and in scent marking. The values for foraging and maintenance (mostly self-grooming) remained relatively high over the next time interval (14:20-14:40), when higher values were also found for social affiliative behaviours (body rubbing and allogrooming) and for resting and sleeping. Meanwhile values for land locomotion, swimming and vigilance were low. Resting and sleeping still represented around 20% of the time budget during the 15:10-15:30 interval, when there was a peak in playing, usually represented by solitary play with a pebble or shell. A scatter feed usually occurred during the 15:50-16:10 interval which was associated with a greater diversity of behaviours recorded during this interval.
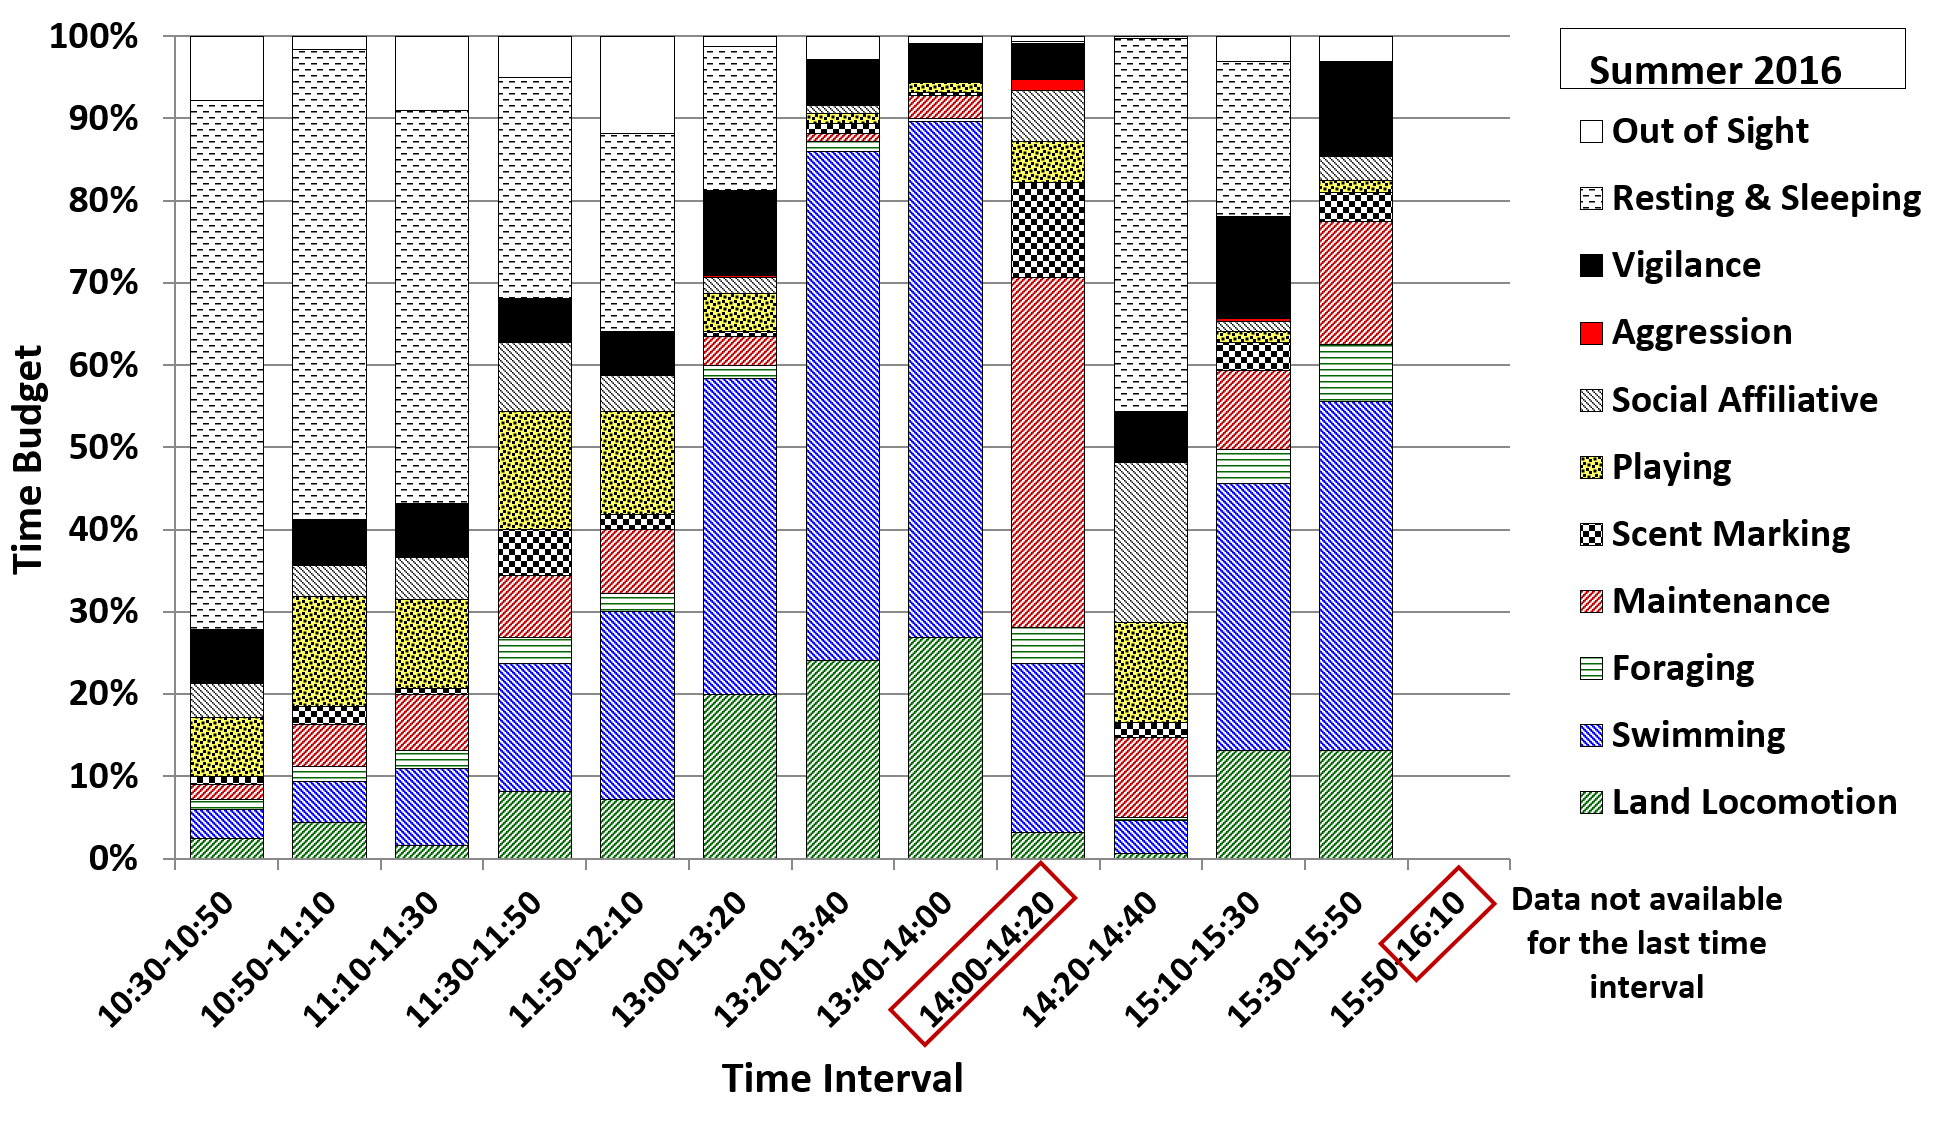
The summer pattern of behaviour under standard feeding strategy (Figure 8, summer 2016) was fairly similar to that seen in winter 2015. During the 13:40-14:00 interval there were higher values for swimming and lower values for vigilance, and during the 14:20-14:40 interval there was less foraging and maintenance and more resting and sleeping. In summer 2016 there was more swimming during the 15:10-15:30 and 15:30-15:50 intervals, compared to winter 2015. During the earlier time intervals, between 10:30 and 12:10 (no winter 2015 data), the majority of the time budget consisted of resting and sleeping and less active behaviours, such as solitary object play, maintenance and social interaction. Land locomotion and swimming gradually increased after 11:30, up to the peaks described above for the 13:40-14:00 interval.
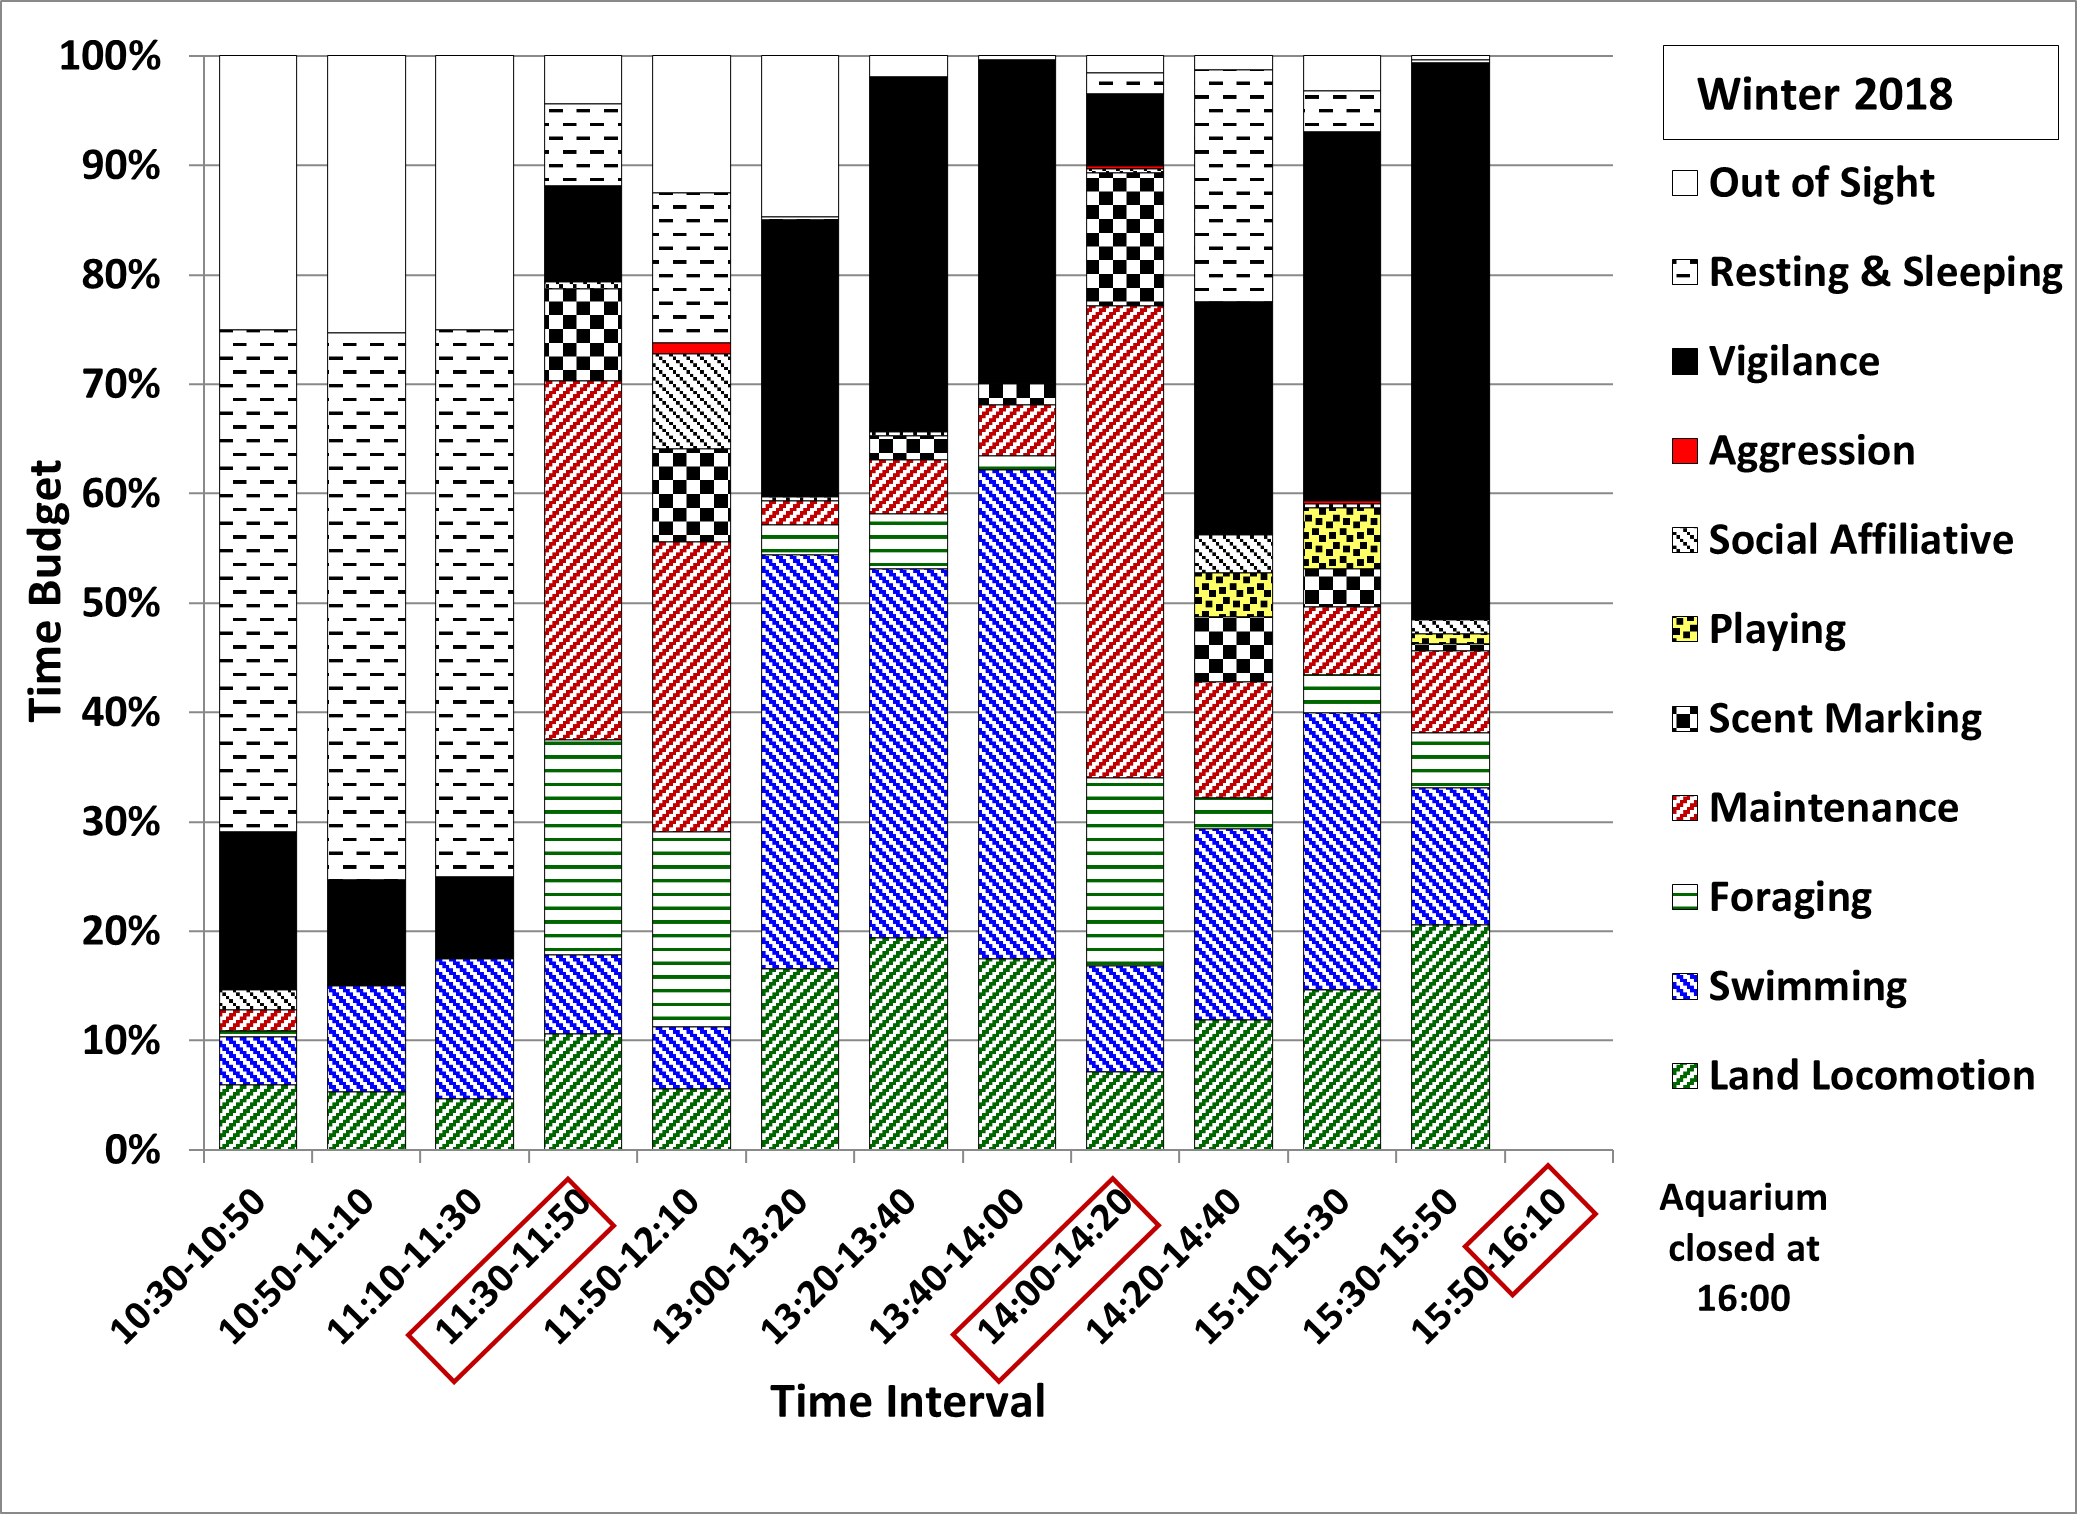
The main difference between winter 2018 (Figure 9; 4 feeds, still only 20% wt/body wt) and winter 2015 was that the values for vigilance were much higher for all time intervals, apart from the 14:00-14:20 interval. The increase in vigilance (up to 5 times) resulted in less social interaction and foraging and more swimming during 14:20-14:40 and much less resting and sleeping during 15:10-15:30. The values for land locomotion and swimming (mostly repetitive, along the same route) were also higher during the 15:30-15:50 interval. For the seven time intervals between 10:30-13:40 (no winter 2015 data) the values for vigilance were higher than for summer 2016 and more time was spent out of sight in the den. The 11:30 feed (scatter feed) was associated with more time spent engaged in maintenance, foraging and scent marking during the 11:30-11:50 and 11:50-12:10 intervals, compared to summer 2016.
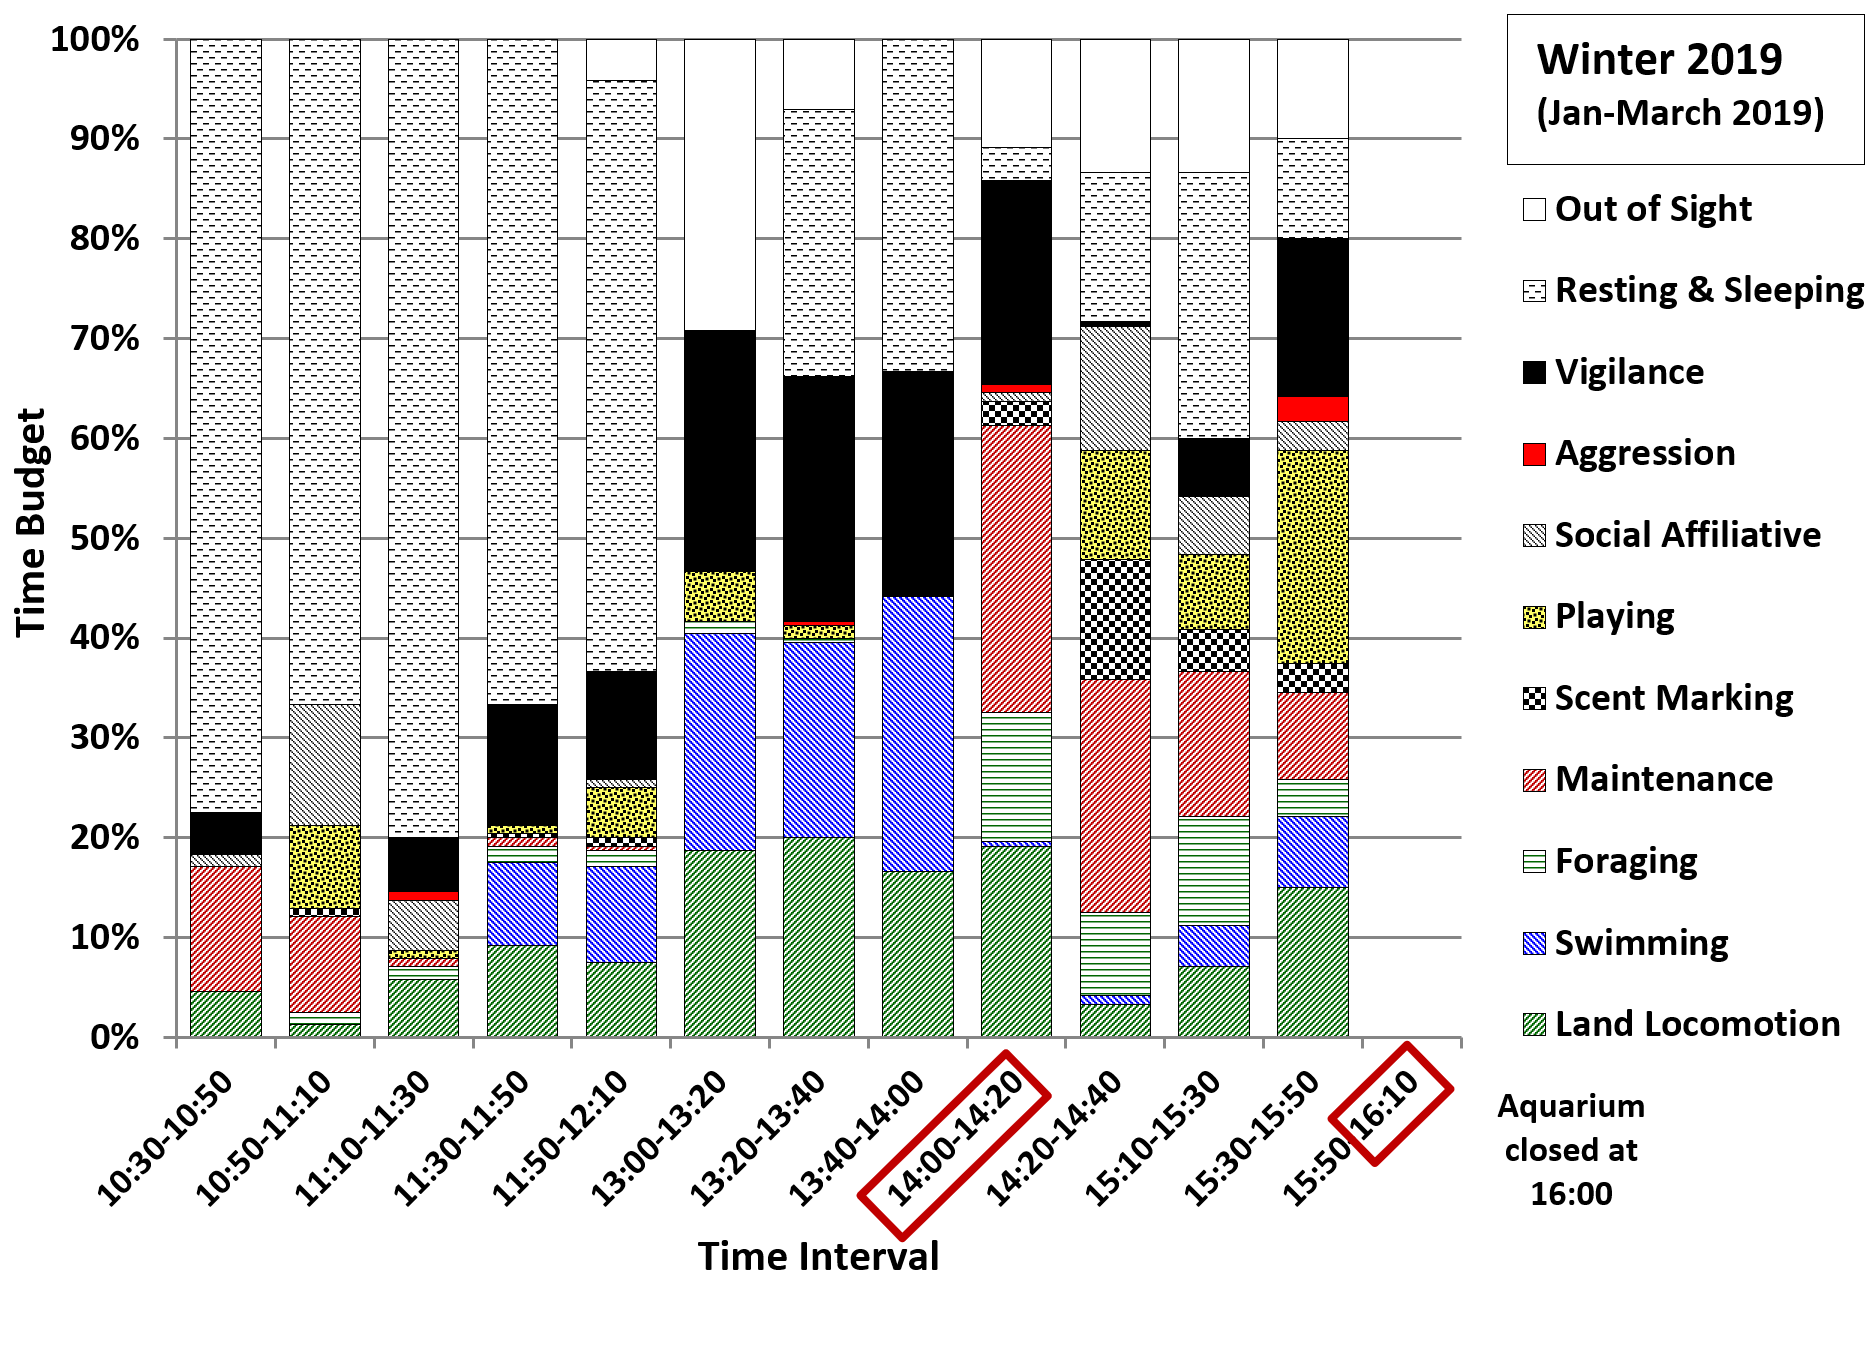
After the increase in the amount of daily feed to 30% wt/body wt and the return to 3 feeds/day in January 2019 (Figure 10; winter 2019) the proportion of time spent displaying vigilance during the 14:20-14:40 interval and later in the afternoon decreased, with increases in the proportion of time spent engaged in social affiliative behaviours, resting and sleeping, playing and being out of sight in the den, compared to winter 2018 and winter 2015. The time budget for the 13:40-14:00 interval in winter 2019 was also different from that seen in the other seasons, with a large proportion of time spent resting and sleeping instead of displaying mostly repetitive running and swimming along the same route. The time budgets for the intervals before 13:40 also consisted of more resting and sleeping compared to both winter 2018 and summer 2016.
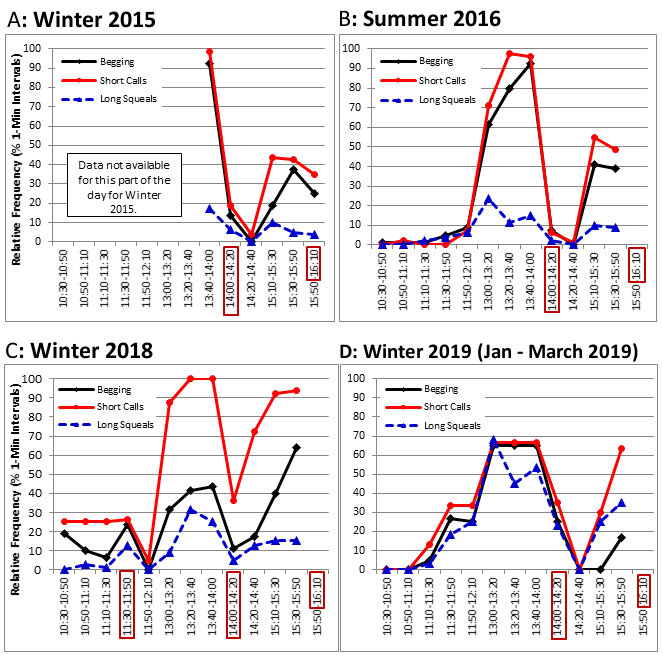
In all four seasons, the daily peaks in vigilance and in repetitive locomotory behaviours (Figures 7-10) were associated with peaks in the relative frequencies of short calls, begging and long squeals (Figure 11 A-D). The values for short calls were higher for most time intervals in winter 2018, compared to summer 2016 and winter 2015. However, the values for begging around the 14:00 feed were lower in winter 2018 compared to all other seasons, but increased to higher values during the 15:10-15:30 and 15:30-15:50 intervals. In winter 2019 the relative frequencies of short calls for all three time intervals between 13:00 and 14:00 were lower than in winter 2018 and summer 2016, while the values for begging around the 14:00 feed were higher compared to winter 2018. The relative frequencies of long squeals were higher in winter 2019 than in other seasons during most of the time intervals.
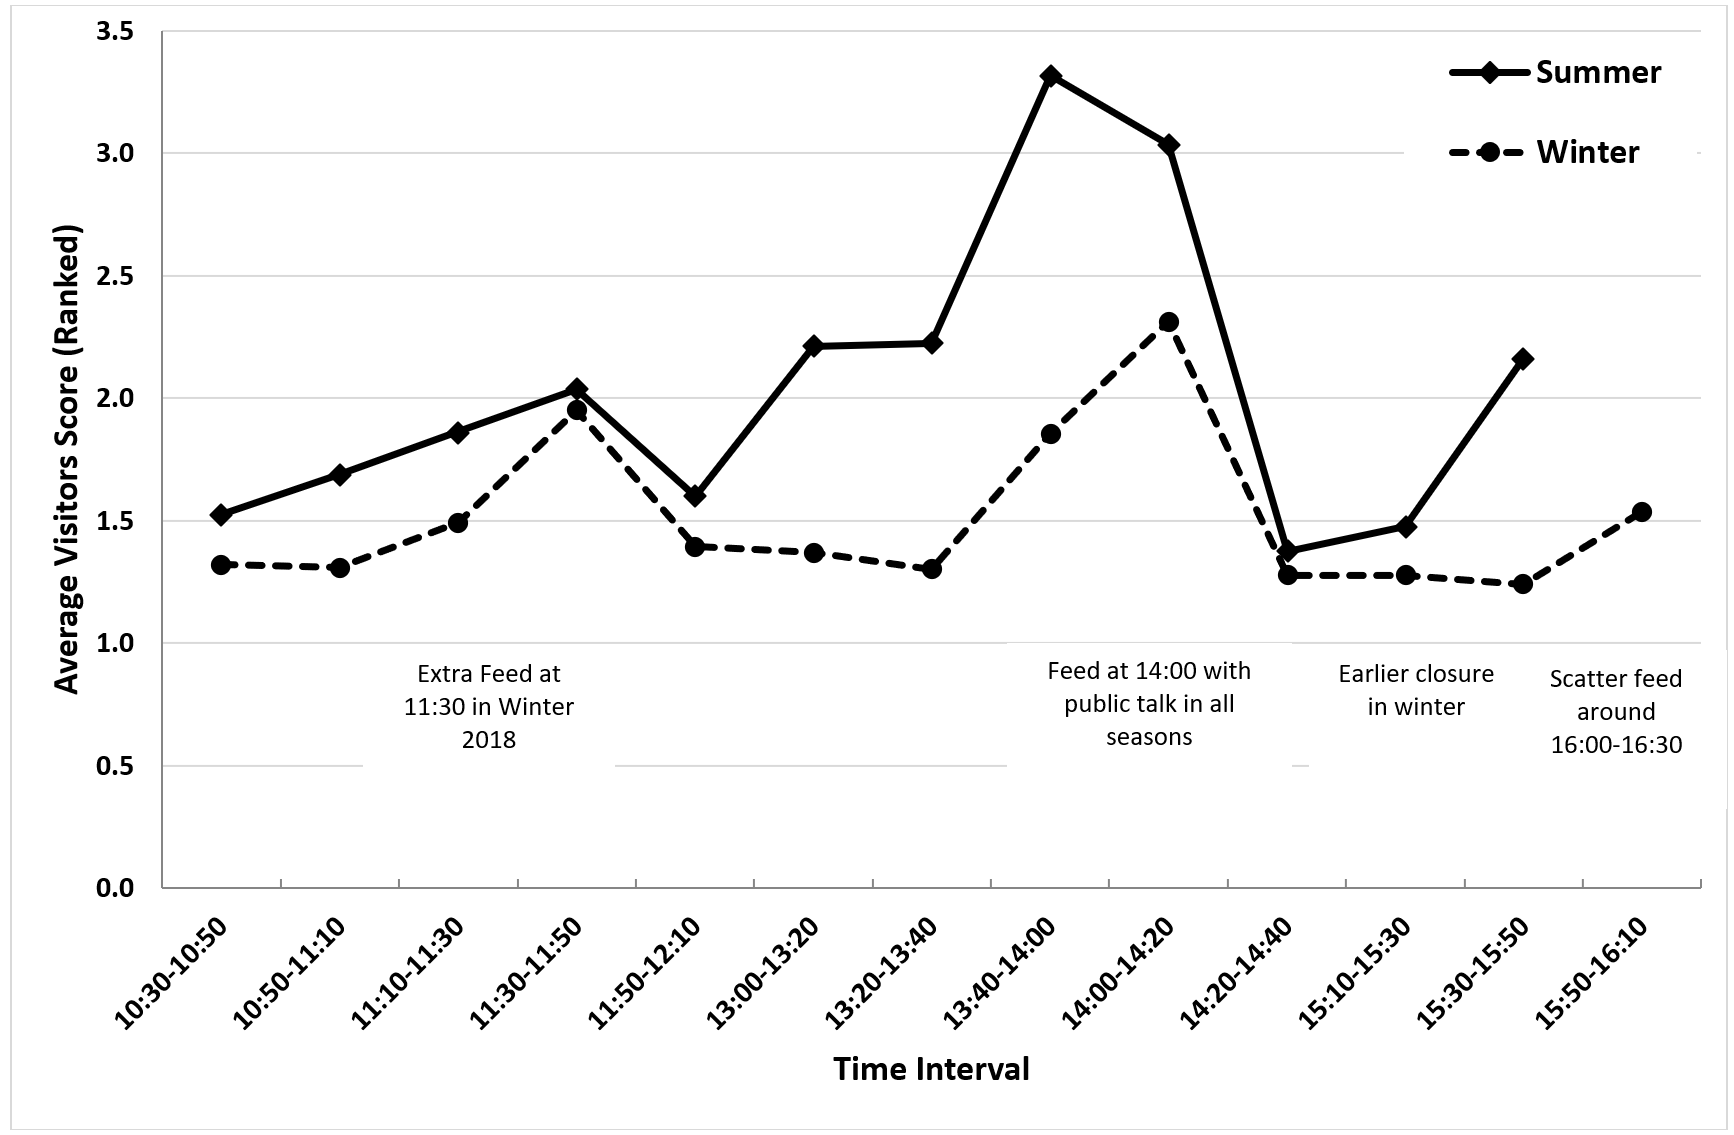
The average visitor score was consistently lower in winter than summer, with peaks in both seasons around 14:00-14:20 when the main feed and public talk took place and around 11:30 (Figure 12). In summer 2016, there was another peak in visitor score around 15:30-15:50 associated with longer opening hours.
DISCUSSION
The behaviour and enclosure use of the pair of ASCO at the Tynemouth Aquarium (TAQ) over four seasons between November 2015 and March 2019 were presented as a case-study to analyse the impact of the introduction of an additional feed without increasing the total amount of food per day in winter 2018, relative to winter 2015 and summer 2016, and of an increase in the total amount of food per day from 20% to 30% of otter body weight in winter 2019, with return to 3 feeds/day, in the context of the influence of seasonal changes in temperature on these tropical mammals.
The additional mid-morning feed introduced in winter 2018 did not appear to have the full desired effect. The aim was to reduce the pattern running and swimming before feeds and the frequencies of up-down stands (begging) and short calls. However, the percentage of time spent displaying vigilance, including begging, and the frequencies of short calls and long squeals increased significantly, to around double the values for winter 2015. The values for land locomotion, swimming and begging increased slightly, while those for foraging on land, resting and sleeping, playing, affiliative social interaction and maintenance decreased compared to winter 2015. Comparing the day-time activity patterns revealed that the additional feed at 11:30 reduced begging before the 14:00 feed, as the otters would have been less hungry than in seasons when they had not eaten since around 9:30. However begging during later afternoon intervals was much more frequent and the values for vigilance and short calls were higher throughout the day, up to values of 51% of the time budget for vigilance and a relative frequency of 64% for begging and 94% for short calls during the 15:30-15:50 time interval. This suggested that splitting the same amount of food between four feeds instead of three, with the extra feed given at a time of the day when the otters were usually resting or engaging in less energetic behaviours, was only partly effective at reducing the abnormal repetitive behaviours (ARBs) of the otters at the TAQ.
The extra feed intervention was based on otter husbandry guidelines (AZA, 2009) that recommended changing the number of feeds per day (3 or more being preferable), the mode of food presentation, to stimulate naturalistic foraging activities, and/or randomising feeds in order to reduce ARBs, informed by earlier studies on ASCO (Foster-Turley and Markowitz, 1982; Hawke et al., 2000; Ross, 2002; Gothard, 2007). Although the ASCO at the TAQ did not display any potentially harmful repetitive behaviours, such as hair plucking or manipulating enclosure doors (Ross, 2002; Morabito and Bashaw, 2012) and aggression levels were low, repetitive begging and short calls occurred during around 30-40% of the observation time in both seasons monitored prior to this intervention. Frequent short calls have been associated with stress in ASCO (Scheifele et al., 2015) and repetitive begging with hunger, rather than being a sign of boredom or an attempt to attract the attention of visitors (Gothard, 2007), whose numbers were lower in winter than in summer on data collection days at the TAQ. In addition, the seasonal differences between winter 2015 and summer 2016, when the male otter spent more time displaying vigilance and foraging on land in winter and less time resting and sleeping suggested higher levels of restlessness in winter. There was also significantly less swimming in winter and in shorter bouts, with corresponding differences in enclosure use, which was probably due to the difference in water temperature (around 12°C in winter 2015 and 20°C in summer 2016). As tropical mammals, ASCO have a higher metabolic rate in cold water compared to other otter species, possibly due to poorer insulative capacity of the fur and skin (Borgwardt and Culik, 1999). ASCO were reported to swim less but rest more in winter compared to summer in both indoor (Cuculescu-Santana et al., 2017) and outdoor enclosures (Cuculescu-Santana et al., 2021) to adjust to the increased energetic demands of thermoregulation in winter.
The introduction of additional methods of food presentation at the TAQ since summer 2015, in the form of using a variety of puzzle-like containers that made extracting food more challenging, was associated with an increase in the percentage of time spent swimming and a decrease in land locomotion in winter 2015, compared to the winter 2013 values from an earlier study at the same establishment (Cuculescu-Santana et al., 2017). This was probably because the puzzle-like containers were often placed in the water, which led to more time spent swimming to retrieve food during feeds and also looking for food at other times, as ASCO have demonstrated ability to remember food locations (Perdue et al., 2013), but did not lead to the desired changes in foraging on land and in all the ARBs targeted. The winter values for foraging on land and vigilance were very similar, the frequency of short calls was lower but that of begging was 1.5 times higher than in winter 2013. Using grapevine balls as food dispensers (Ross, 2002) and a system of catapults for randomised feeding times and locations in the enclosure (Hawke et al., 2000) proved to be effective in reducing ARBs in ASCO at other establishments, but did not increase foraging (Hawke et al., 2000). The limitations in space and scope for naturalistic foraging activities are a likely contributor to the prevalence of stereotypical behaviours in captive ASCO, who spend up to 40-60% of their time in the wild foraging (Heap et al., 2008) and in other otter species, such as the North American river otters Lontra canadensis (Morabito and Bashaw, 2012), who spend around 60% of their active time foraging and hunting in the wild (Davis et al., 1992). This suggested that more inventive or more varied feeding enrichment methods must be implemented to stimulate foraging.
Because the more varied feeding enrichments at the TAQ had only a limited impact on ARBs and the extra feed introduced in winter 2018 had some undesirable effects, an increase in the amount of food provided was considered. Hunger is suspected as a cause of ARBs in otters (Gothard, 2007) but nutrition guidelines for ASCO recommend caution with increasing the amount of food in the cold season to avoid unhealthy weight gain (Henry et al., 2012), as many otters become less active in cold weather (AZA, 2009). However, the otters at the TAQ became more active throughout the day in winter 2018 (November-December 2018) compared to summer 2016 and winter 2015. This was mainly due to the reduction in time spent resting and sleeping after the feed at 14:00, when they continued to forage, swim, run around and display vigilance, instead of retreating to their preferred sleeping place and engaging in affiliative social interactions and self-grooming prior to settling down to sleep (Cuculescu-Santana et al., 2017). They remained relatively restless during the rest of the observation time up to 15:50 when the aquarium was closed to the public. Resting, sleeping and play are key behavioural indicators of welfare and habitat quality in captivity, with the increased prevalence of play behaviours also being linked to nutritional availability in captive mammals (Gothard, 2007; Sarti Oliveira et al., 2010). Moreover, the temperatures in January 2019 were even lower than at the end of 2018, which ultimately led to the decision to return to 3 feeds/day and increase the amount of food to 30% weight/ body weight.
The renewed attempt to reduce the frequency of ARBs at the TAQ appeared to be more successful, as the percentage of time spent displaying vigilance decreased significantly in winter 2019 compared to winter 2018, to values similar to those recorded for winter 2015. The male otter also spent significantly less time swimming, slightly less time engaged in land locomotion and more time playing, resting and sleeping and out of sight in the den compared to all other seasons. The time spent in affiliative social interaction increased relative to winter 2018, to values still lower than those recorded in winter 2015 and summer 2016, although it is very likely that some affiliative social interaction occurred during the time spent out of sight in the den, under the heat lamp. The overall frequency of begging decreased to values lower than in all previous seasons and that of short calls decreased to values similar to those for winter 2015 and summer 2016. These changes in behaviour were consistent with the changes in enclosure use, with significant decreases in the use of the pools and the log bridges, where begging was usually displayed, as these were the closest to the areas where the keepers and the visitors were located or passing by, and significant increases in the use of the den and the climbing structures. The further decrease in the time spent swimming was most likely due to their faster rate of heat dissipation in cold water compared to the cold-adapted Eurasian otter Lutra lutra (Kuhn, 2009; Kuhn and Meyer, 2009). Water temperatures in January-March 2019 (winter 2019) were around 9-10°C, which is below the lower end of the thermoneutral zone for ASCO (16°C, Borgwardt and Culik, 1999) and below the recommended range of water temperatures for ASCO (18.3-29.4°C, Heap et al., 2008). The other changes in behaviour appeared to support the link between hunger and ARBs associated with feeding anticipatory activity proposed by Gothard (2007) and Cuculescu-Santana et al. (2017) and the link between play behaviour and a well-fed and healthy state proposed by Sarti Oliveira et al. (2010), with the additional food offsetting the increased energy requirements for thermoregulation and providing more energy for social and leisure behaviours.
It was interesting to note that in winter 2019 the otters still displayed a peak in begging and short calls around the time of the former mid-morning feed in winter 2018, which had not been seen in summer 2016, nor in winter 2015. No quantitative data were available for this interval in winter 2015, but qualitative observations of the second author during frequent visits to the TAQ suggested that the otters were usually sleeping between 10:30 and 12:30. The regularity of feeding times is known to influence the circadian rhythm of carnivores (Mistlberger, 2011), a process which allows for the optimal display of behaviours and physiological processes such as salivation and digestion in relation to the time of day (Bassett and Buchanan-Smith, 2007; Carneiro and Araujo, 2012) and it is very likely that the otters at the TAQ were still adjusting their circadian rhythm from that entrained by the feeding schedule used in winter 2018.
The analysis of the day-time activity patterns of the otters at the TAQ supported the hypothesis that repetitive begging is a more likely indicator of hunger (Gothard, 2007), while short calls are indicators of stress (Scheifele et al., 2015). In winter 2019, the values for begging before the feed at 14:00 were higher than in winter 2018, but during later afternoon they did not increase as much as in winter 2018 and were also lower than in summer 2016 and winter 2015. The frequencies of short calls before the feed at 14:00 and during later afternoon up to 15:30, were lower than in all other seasons, suggesting less stress associated with hunger when the amount of food was increased to 30% of body weight. It was not very clear why the frequency of long squeals was overall significantly higher in winter 2019 than in all other seasons, particularly between 13:00-14:00 and 15:10-15:50, when the keepers were passing by the otter enclosure more frequently. It is possible that this was related to the increased frequency of interaction between otters and keepers in February-March 2019 as part of the training to prepare them for travel, in the period leading up to their move to another establishment.
While this case-study is limited to one establishment and two otters, it provides useful insights into the impact of different changes in feeding strategy on the behavioural budgets, enclosure use and day-time activity patterns of a species for which only a small number of published peer-reviewed studies are available. Other limitations were the lack of more detailed information about any fluctuations in otter weights and the combined influence of seasonality and changes in feeding strategies on the otters’ behaviour. We have tried to address the latter by providing data for a winter (2015) and summer (2016) season with similar feeding strategies and by using only the data for the time intervals covered in all four seasons for the main analysis of differences in behaviour and enclosure use.
CONCLUSIONS AND RECOMMENDATIONS
Increasing the amount of food provided per day from 20% to 30% of the otters’ body weight proved to be more effective at reducing abnormal repetitive behaviours (ARBs) associated with feeding anticipation and stress than increasing the number of feeds from 3 to 4 per day, with the same total amount of food (20% of body weight).
Seasonal changes in temperature influenced the behaviour of captive Asian small-clawed otters, suggesting changes in thermoregulatory costs and energy budgets and highlighting the importance of considering how local climate affects enclosure conditions when assessing the nutritional, enrichment and climatisation needs of this tropical species of otters.
More research is needed into the behavioural and physiological effects of changes in temperature and feeding strategies on captive otters, to validate these findings.
Supplementary Material (PDF 404 KB)
Acknowledgements: The authors would like to thank Susie Lovick-Earle, Cassandra Naisbitt, Catherine Ward and all other staff at the Tynemouth Aquarium (formerly the Blue Reef Aquarium Tynemouth) for their enthusiasm and support with this project and for looking after the otters. The work was carried out within the standard workloads of staff and students at Northumbria University and staff at the Tynemouth Aquarium.
REFERENCES
AZA (2009). Otter (Lutrinae) Care Manual. Silver Spring, MD: Association of Zoos and Aquariums. 154 p.
Bassett, L., Buchanan-Smith, H.M. (2007). Effects of predictability on the welfare of captive animals. Appl. Anim. Behav. Sci. 102(3-4): 223-245.
Bateman, H.L., Bond, J.B., Campbell, M., Barrie, M., Riggs, G., Snyder, B., Swanson, W.F. (2009). Characterization of basal seminal traits and reproductive endocrine profiles in North American river otters and Asian small-clawed otters. Zoo Biol. 28: 107-126.
Bishop, J., Hosey, G., Plowman, A. (2013) Handbook of Zoo Research. Guidelines for Conducting Research in Zoos. London. BIAZA. 231 p.
Borgwardt, N., Culik, B.M. (1999). Asian small-clawed otters (Amblonyx cinerea): resting and swimming metabolic rates. J. Comp. Physiol. B 169: 100-106.
Carneiro, B.T.S., Araujo, J.F. (2012). Food entrainment: Major and recent findings. Front. Behav. Neurosci. 6: 83. doi: https://doi.org/10.3389/fnbeh.2012.00083
Cianfrani, C., Broennimann, O., Loy, A., Guisan, A. (2018). More than range exposure: Global otter vulnerability to climate change. Biol. Conserv. 221: 103-113.
CITES (2019) Convention on International Trade in Endangered Species of Wild Fauna and Flora. Appendices I, II and III (26/11/2019). United Nations Environment Programme, 75p.
Cuculescu-Santana, M., Horn, C., Briggs, R.N., Bowe, C., Geraughty, M.L. (2017). Seasonal changes in the behaviour and enclosure use of captive Asian small clawed otters Aonyx cinereus. IUCN Otter Spec. Group Bull. 34(1): 29-50.
Cuculescu-Santana, M., Mason, J., Purchase, K., McKie, R. (2021). Outdoor enclosure use and behaviour of adult and cub Asian small-clawed otters Aonyx cinereus in summer and winter. IUCN Otter Spec. Group Bull. 38: 3-27.
Davis, H.G., Aulerich, R.J., Bursian, S.J., Sikarskie, J.G., Stuht, J.N. (1992). Feed consumption and food transit time in Northern river otters (Lutra canadensis). Journal of Zoo and Wildlife Medicine, 23(2): 241-244.
Dornbusch, T., Greven, H. (2009). Notes on keeping of Asian small-clawed otters (Amblonyx cinereus) in European zoos. Zool. Garten 78: 75-80. [In German with English abstract].
Foster-Turley, P., Markowitz, H. (1982). A captive behavioral enrichment study with Asian small-clawed river otters (Aonyx cinerea). Zoo Biology, 1: 29-43.
Gothard, N. (2007). What is the proximate cause of begging behaviour in a group of captive Asian short-clawed otters? IUCN Otter Spec. Group Bull. 24: 14-35.
Harrington, L.A., Macdonald, D.W., D’Cruze, N. (2019). Popularity of pet otters on YouTube: evidence of an emerging trade threat. Nat. Conserv. 36: 17–45.
Hawke, L., Lauer, P., Bartholomeusz, D., Steen, Z. (2000). Effects of increased food dispersal and random feeding time/ place on stereotyped behaviours in otters at Adelaide Zoo. Int. Zoo News 47: 71-81.
Heap, C.J., Wright, L., Andrews, L. (2008). Summary of husbandry guidelines for Asian small clawed otters in captivity. IUCN/ SSC Otter Specialist Group, Otters in Captivity Task Force. 17 p.
Henry, B., Maslanka, M., Heuer, K., Reed-Smith, J., Nidasio, G. (2012). Summary of nutrition guidelines for otters in zoos, aquaria, rehabilitation and wildlife sanctuaries. IUCN/ SSC Otter Specialist Group, Otters in Zoos, Aquaria, Rehabilitation and Wildlife Sanctuaries Task Force. 26 p.
Janusz, M.A. (2017) The effect of enrichment on the behaviour and enclosure use of Asian small-clawed otters (Aonyx cinereus) at the Blue Reef Aquarium Tynemouth. BSc Project Report. Northumbria University, Newcastle upon Tyne, UK. 55 p.
Kitade, T., Naruse, Y. (2018). Otter Alert: A rapid assessment of illegal trade and booming demand in Japan. TRAFFIC Japan Office, 31 p.
Kruuk, H. (2006). Otters: ecology, behaviour and conservation. Oxford University Press. 265 p.
Kuhn, R. (2009). Comparative analysis of structural and functional hair coat characteristics, including heat loss regulation, in the Lutrinae (Carnivora: Mustelidae). PhD Thesis. University of Hamburg, Hamburg, Germany. 225 pp.
Kuhn, R.A., Meyer, W. (2009). Infrared thermography of the body surface in the Eurasian otter Lutra lutra and the giant otter Pteronura brasiliensis. Aquat. Biol. 6: 143-152.
Ladds, Z., Hoppitt, W., Boogert, N.J. (2017). Social learning in otters. R. Soc. open sci. 4: 170489.
Larivière, S. (2003). Amblonyx cinereus. Mamm. Species 720: 1-5.
Manns, M., Ströckens, F., Stavenhagen, P., Ocklenburg, S. (2018). Paw preferences in the Asian small-clawed otter – using an inexpensive, video-based protocol to study laterality of rare species in the zoo. Laterality. 23(6): 722-737.
Martin, P., Bateson, P. (2007) Measuring behaviour. An introductory guide. 3rd Edition. Cambridge University Press. 176 p.
Mason, G. (2010). Species differences in responses to captivity: Stress, welfare and the comparative method. Trends Ecol. Evol. 25(12): 713-721.
Mistlberger, R.E. (2011). Neurobiology of food anticipatory circadian rhythms. Physiol. and Behav. 104: 535-545.
Morabito, P., Bashaw, M.J. (2013). A survey of abnormal repetitive behaviours in North American river otters housed in zoos. J. Appl. Anim. Welf. Sci. 15: 208-221.
Perdue, B.M., Snyder, R.J., Zhihe, Z., Marr, M.J., Maple, T.L. (2011). Sex differences in spatial ability: A test of the range size hypothesis in the order Carnivora. Biol. Lett. 7: 380-383.
Perdue, B.M., Snyder, R.J., Maple, T.L. (2013). Cognitive research in Asian small-clawed otters. Int. J. Comp. Psychol. 26: 105-113.
Reed-Smith, J., Polechla, P.J.Jr. (2002). Husbandry and captive breeding of otters (Lutrinae) in North and Latin America: A synopsis of current progress. Proc. VIIth International Otter Colloquium, p 276-281.
Rees, P.A. (2015). Studying captive animals: A workbook of methods in behaviour, welfare and ecology. Wiley-Blackwell. 301 p.
Ross, S.R. (2002). The effect of a simple feeding enrichment strategy on the behaviour of two Asian small-clawed otters (Aonyx cinerea). Aquat. Mammals 28: 113-120.
Sarti Oliveira, A.F., Olieira Rossi, A., Romualdo Silva, L.F., Correa Lau, M., Barreto, R.E. (2010). Play behaviour in nonhuman animals and the animal welfare issue. J. Ethol. 28: 1-5.
Scheifele, P.M., Johnson, M.T., Fry, M., Hamel, B., Laclede, K. (2015). Vocal classification of vocalizations of a pair of Asian Small-Clawed otters to determine stress. J. Acoust. Soc. Am. 138: EL105-EL109.
Schmelz, M., Duguid, S., Bohn, M., Völter, C.J. (2017). Cooperative problem solving in giant otters (Pteronura brasiliensis) and Asian small-clawed otters (Aonyx cinerea). Anim. Cogn. 20(6): 1107-1114.
Wright, L., de Silva, P., Chan, B., Reza Lubis, I. (2015). Aonyx cinereus. The IUCN Red List of threatened species 2015. Downloaded 30 January 2016. Available from https://dx.doi.org/10.2305/IUCN.UK.2015-2.RLTS.T44166A21939068.en
Résumé: Stratégies d’Alimentation de la Loutre Cendrée (Aonyx cinereus, Illiger, 1815) en Captivité: Quelles Mesures Efficaces pour Réduire Anticipativement l’Activité Répétitive d’Alimentation durant la Saison Froide?
Cette étude de cas a analysé le comportement et l’utilisation de l’enclos d’un couple de loutres cendrées pour étudier l’impact des changements de stratégie d’alimentation sur les comportements répétitifs associés à l’anticipation de l’alimentation, dans le contexte de l’influence des changements saisonniers de température sur ces mammifères tropicaux.
Les loutres ont un comportement de moindre natation, repos et sommeil mais davantage de mendicité, de vocalisations et de vigilance globale en hiver par rapport à l’été, suggérant un plus grand appétit dû aux besoins énergétiques accrus pour la thermorégulation.
L’introduction d’un complément alimentaire en milieu de matinée en hiver sans augmenter la quantité totale de nourriture par jour n’a été que partiellement efficace sur les comportements ciblés. Les manifestations de vigilance et les vocalisations globales ont augmenté de manière significative, le repos et le sommeil ont diminué, mais la mendicité n’a pas changé par rapport aux valeurs hivernales et estivales précédentes. La mendicité avant le repas de 14h était moins fréquente, suggérant un moindre appétit à ce moment-là, mais a augmenté vers des valeurs plus élevées en fin d’après-midi.
Une augmentation journalière de la quantité totale de nourriture de 20 % à 30 % du poids corporel de la loutre en janvier 2019, avec un retour à 3 repas/jour, a été plus efficace pour réduire les comportements ciblés. Il y a eu une diminution des manifestations de vigilance globale et des fréquences de mendicité et d’appels courts et une augmentation des comportements de jeu, des interactions sociales d’affiliation et du repos et du sommeil, suggérant une réduction des niveaux de faim et de stress associés.
Cette étude a souligné l’importance de voir comment le climat local affecte les conditions de captivité lors de l’évaluation des besoins nutritionnels, d’enrichissement et de climatisation de l’enclos pour les loutres cendrées.
Revenez au dessus
Resumen: Estrategias de Alimentación para Nutrias de Uñas Pequeñas Asiáticas (Aonyx cinereus, Illiger, 1815) en Cautiverio: ¿Qué es lo que Funciona para Reducir la Actividad Anticipatoria Repetitiva de Alimentación durante la Estación Fría?
Este estudio de caso analizó el comportamiento y el uso del recinto por una pareja de Nutrias de Uñas Pequeñas Asiáticas, para investigar el impacto de cambios en la estrategia de alimentación sobre los comportamientos repetitivos asociados a la anticipación de la alimentación, en el contexto de la influencia de los cambios estacionales de la temperatura en estos mamíferos tropicales.
Las nutrias desplegaron menos natación y descanso, menos sueño y más actividad de pedir, vocalizaciones y vigilancia general en invierno en comparación con el verano, lo que sugiere que tenían más apetito debido al aumento de la demanda energética para termoregulación.
La introducción de una sesión de alimentación a media mañana durante el invierno, sin aumentar el monto total de comida por día, fue sólo parcialmente efectiva respecto a los comportamientos que se evaluaban. Los despliegues de vigilancia general y las vocalizaciones aumentaron significativamente, el descanso y el sueño disminuyeron, pero la actividad de pedir no cambió, en comparación con valores de inviernos y veranos previos. La actividad de pedir antes de la sesión de alimentación de las 14:00 hs fue menos frecuente, lo que sugiere que tenían menos apetito en ese momento, pero se incrementó a valores más altos más avanzada la tarde.
Algo que fue más efectivo para reducir los comportamientos señalados, fue un incremento -en Enero de 2019- en el monto total de alimento por día, de 20% del peso corporal a 30 %, volviendo a 3 sesiones de alimentación/día. Hubo disminuciones en los despliegues de vigilancia y en las frecuencias de “pedir” y de llamads cortos, y aumentos en los comportamientos de juego, interacciones sociales afiliativas y descanso y sueño, lo que sugiere una reducción en los niveles de hambre y el stress relacionado.
Este estudio enfatiza la importancia de considerar cómo el clima local afecta las condiciones de los recintos, cuando se evalúan las necesidades nutricionales, de enriquecimiento y climatización de las nutrias de uñas pequeñas asiáticas.
Vuelva a la tapa

